


Contents
Scroll to:
https://doi.org/10.47093/2218-7332.2025.16.1.4-19
Scroll to:
Aim. To study morphological and developmental changes in the structure of mice’s limbic system, which overexpress 70 kDa heat shock proteins (HSP70) and co-express mutant fused-in-sarcoma (FUS) protein with amyotrophic lateral sclerosis (ALS).
Materials and methods. The study was based on mice (n = 36; six for each group) of six lines either without FUS mislocalization: C57Bl/6 (wild-type); extracellular (HSP70out) or intracellular (HSP70in) overexpression of HSP70 family 1A protein; or with FUS mislocalization: transgenic mice with ALS-FUS (FUS[1-359]); and double transgenic animals (FUS[1-359]/HSP70out and FUS[1-359]/HSP70in). All FUS expressing mice were symptomatic with myasthenia up to limb paralysis in some animals. When the mice were 20 weeks old, they were killed by staining histological slides of their brain using hematoxylin and eosin, toluidine blue by Nissl, immunofluorescent antibodies for the neuronal nuclear marker (NeuN) of the caudoputamen, septal nuclei, and hippocampus, as well as glial fibrillar acid protein (GFAP), S100β protein, and synaptophysin for the hippocampus. The number of neurons and the number of cells with a positive reaction to antibodies were counted. The statistical processing included ANOVA and were compared with the results from the Tukey test for.
Results. Statistically significant differences were observed for the FUS-expressing groups compared to FUS-negative groups: (1) a reduction in the number of neurons and NeuN+-cells in the caudoputamen and amygdala, especially for FUS[1-359]/HSP70out group; (2) an increase in the number of hyperchromic neurons in the subiculum, cornu Ammonis (CA1), and dentate gyrus, with a significantly greater increase for FUS[1-359] and FUS[1-359]/HSP70out groups compared to FUS[1-359]/HSP70in group; (3) an increase in the number of GFAP+and S100β+-cells in the hippocampus, with the most pronounced change for the FUS[1-359] and FUS[1-359]/HSP70out groups compared to с FUS[1-359]/HSP70in group.
Conclusion. An overexpression of HSP70 family 1A protein and co-expression of mutant FUS protein in the cytoplasm is accompanied by mitigated neurodegeneration in the structure of the limbic system compared with the expression of mutant FUS protein alone.
Amyotrophic lateral sclerosis (ALS) is a neurodegenerative disorder primarily affecting the motor regions of the nervous system [1]. The disorder is characterized by high rates of disability and mortality, with no effective treatment methods available [2]. The development of ALS treatment principles is challenging due to the fact that ALS can arise from mutations in various genes [3] with different clinical phenotypes [4]. Given these differences, research that examines molecular mechanisms that counteract key pathological changes in the most common genetic variants of ALS is in high demand.
One of the genes that can mutate leading to the development of ALS encodes human RNA-binding protein “fused-in-sarcoma (FUS)” and is normally localized in the nucleus [5]. Aberrant FUS protein leaves the cell nucleus, and its pathological accumulation in the cytoplasm of neurons underlies the FUS variant of ALS, FUS-ALS, and associated cell death [6]. A promising direction in studying this problem is the search for experimental conditions to reduce the severity of neurodegenerative changes related to the cytoplasmic accumulation of FUS.
Thus, pathological protein accumulation in the cytoplasm can be controlled using molecular chaperones, particularly 70 kDa heat shock proteins (HSP70) [7]. It has been also shown that HSP70 can affect the accumulation of mutant FUS protein in FUS-ALS [7][8].
It should be emphasized that HSP70 member 1A (HSPA1A) is a constant, homeostatic component of the cytosol [9], which does not prevent the development of FUS-ALS. It is likely that the amount or activity of HSPA1A in patients with FUS-ALS is insufficient to prevent a pathological FUS accumulation. One may therefore assume that overexpression of HSPA1A favorably affects neuronal survival in ALS with cytoplasmic FUS accumulation [7].
In ALS, damage occurs in the motor areas of the cerebral cortex, the limbic system, as well as motor neurons in the spinal cord and motor plaques [1][10]. However, changes in the structures of the limbic system have been the least studied, although the basal ganglia are involved in the pathogenesis of ALS [10]. For example, as of 01.12.2024, a search in the PubMed database using tags “FUS + ALS + brain”, “FUS + ALS + spinal cord”, “FUS + ALS + muscle” reveals more than 200 publications, while “FUS + ALS + hippocampus” reveals 21 publications, “FUS + ALS + striatum” yields 2 publications, and “FUS + ALS + amygdala” did not appear in any publications.
Aim of the study: to investigate morphological changes in the structures of the limbic system in mice overexpressing HSP70 and expressing mutant FUS protein with ALS development.
Animal experiments
The study was conducted using 36 wild-type (WT) and transgenic mice weighing 32.0±2.5 g. The mice were divided into six groups (n = 6 per group). Only healthy animals (except ALS) were included. The mice were obtained from the vivarium at Sechenov University.
Group 1 included C57Bl/6 mice (WT), selected using the random number method. The randomization for Groups 2 to 6 was based on the genotype of the animals. Group 2 included transgenic animals with the human FUS[ 1-359] gene, expressing mutant FUS protein with the development of FUS-ALS. The FUS expression model described in the work of T.A. Shelkovnikova et al. [11] was implemented. Group 3 (HSP70out) included transgenic mice with extracellular expression of HSPA1A, and the fourth group (HSP70in) included mice with intracellular expression of HSPA1A. Groups 2 to 4 were formed with respect to polymerase chain reaction data, including only animals with hemizygous genes of FUS[ 1-359] and HSPA1A. Homozygous animals with the phenotype corresponding to Groups 2 to 4 served to breed double transgenic mice: Group 5 (FUS[ 1-359]/HSP70out) and Group 6 (FUS[ 1-359]/HSP70in).
The mice were kept in the vivarium at a temperature of 20–22 °C and with a humidity of 55–60% with free access to clean water and granulated food ad libitum. In groups expressing FUS, starting from 10–12 weeks of age, muscle weakness signs gradually increased, progressing up to paralysis in some animals. These symptoms primarily affected one of the hind limbs sometimes affecting both ones or manifesting in the forelimbs. At the same time, sexual activity decreased, but food intake did not. These changes were not observed in FUS-negative groups.
At Week 20, the animals were killed by decapitation (Fig. 1). Anesthesia was induced with 5 mg/kg of xylazine hydrochloride (Interchemie, Netherlands) and 40 mg/kg of tiletamine/zolazepam (Virbac, France).
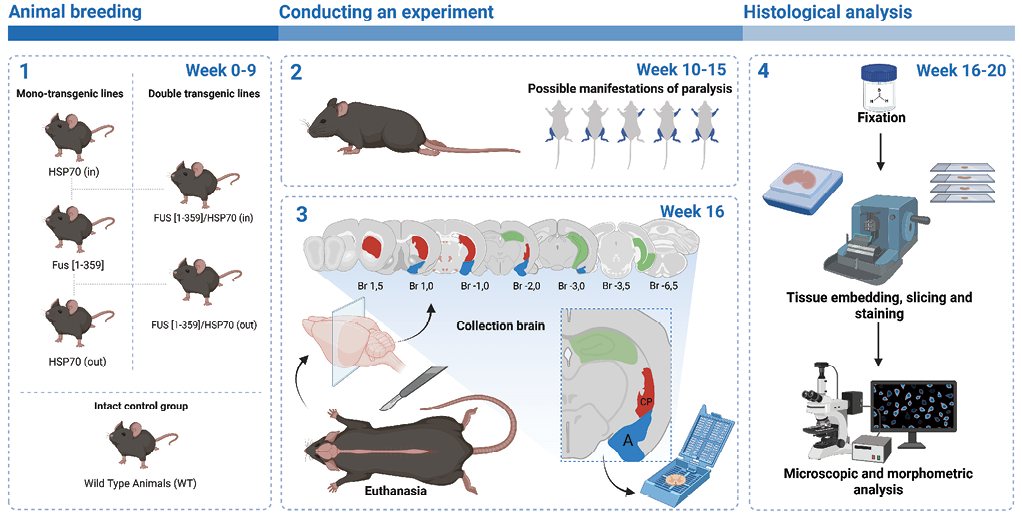
FIG. 1. Design of the experimental study.
Note. WT – wild type.
Preparation of histological specimens
The brains were placed in 10% neutral buffered formalin (ErgoProduction LLC, Russian Federation). Twenty-four hours later, the organs were put into isopropyl alcohol of increasing concentrations (Biovitrum LLC, Russian Federation) and then finally placed into paraffin. Coronal sections 3 µm thick were made with HM325 rotary microtome (Thermo Fisher Scientific, USA), transferred onto silane-coated adhesive slides (Minimed LLC, Russian Federation), and dried at 37 °C.
Staining of specimens
For the purposes of a histological study, the specimens were stained with hematoxylin and eosin or toluidine blue by Nissl method. For immunofluorescent (IF) staining, after incubation in a dewaxing retrieval buffer solution (pH 9.0, 20×, lot XF05RT4N9592, Elabscience, China), the sections were washed with 10% PBS (Eco-Service LLC, Russian Federation), bovine serum albumin (lot RM-T1725/1000, Biosera, France) was added for 30 min, and then primary antibodies were added with accordance to the manufacturers’ recommendations.
In order to identify neurons, monoclonal antibodies to neuronal nuclear marker (NeuN) (1:1000, clone SR45-07, item number ET1602-12, lot H661803001, Huabio, PRC) were used. And in order to detect activated astrocytes, we employed monoclonal antibodies to glial fibrillary acidic protein (GFAP) (1:500, clone SA03-04, item number ET1601-23, lot HO0913, Huabio, PRC) and S100β protein (1:1000, clone SC57-02, item number ET-1610-3, lot H661380007, Huabio, PRC) were used. To assess the level of synaptic contacts, polyclonal antibodies to synaptophysin (SYP) (1:200, item number O407-2, lot HG0614, Huabio, PRC) were used. After staining with primary antibodies, the samples were washed three times, and polyclonal secondary antibodies (Anti-Rabbit-TRITC, 1:100, item number E-AB-1053, lot 22038, Elabscience, PRC) were applied, followed by DAPI staining (item number E-IR-R103, Elabscience, PRC). We washed the specimens with PBS and mounted them with coverslip.
Morphometric study
On the relevant sections, we identified the structure of rodent limbic system (6 fields of view per animal). According to the stereotaxic atlas [12], the following were identified: caudoputamen (CP); caudal part of the lateral septal nucleus (LSc); hippocampal formations, including dorsal part of the hippocampal subiculum (SUBd), regions of the hippocampus proper, or cornu Ammonis (CA1 and CA3), and dentate gyrus (DG); amygdala nuclei, namely lateral nucleus (LA), ventral part of the basolateral nucleus (BLAv), anterior and posterior parts of the basolateral nucleus (BLAa/BLAp), and lateral part of the central nucleus (CeL). Photographs were taken using the Axio Imager.A1 complex with ×40 and ×100 objective magnification, including the Axiocam 305 color camera and Zen 3.10 software (Zeiss, Germany).
The number of neurons per field of view was counted for CP, LSc, and amygdala structures. For hippocampal formations and LSc, the number of hyperchromic neurons was counted, and in CP, the number of neurons with eosinophilic cytoplasm, too. For antibody staining, microphotographs of hippocampal structures, CP, and LSc were taken at fluorescent wavelengths from 540 to 620 nm. The total number of NeuN-positive cells per field of view in CP and LSc zones and the ratio of NeuN+ cells to DAPI-stained cells in hippocampal structures were counted.
The following changes were considered as neurodegenerative ones: a reduction in the total number of neurons per field of view, the appearance of hyperchromic neurons or neurons with eosinophilic cytoplasm, as well as a reduction in the number of NeuN-positive cells or the NeuN/DAPI ratio compared to the control group (WT). In the hippocampus and LSc zone, the proportion of GFAP-positive cells per field of view, given as percents, and the number of S100β-positive cells per field of view were also counted. An increase in GFAP and S100β expression was considered to be indicative of an astrocyte activation, and together with neurodegenerative changes, an indicator of neuroinflammation. For the hippocampus and CP zone, the level of SYP expression was calculated as the ratio of SYP expression area to the field-of-view area, given as percentages. The SYP expression area was assessed using open-source machine learning software QuPath 0.5.0 [13].
Statistical analysis
IF study data were assessed for normality using Shapiro–Wilk test. Mean values of the samples were compared using single-factor analysis of variance (ANOVA) with Tukey’s post hoc test. Differences with a p value of less than 0.05 were considered statistically significant, with a sample size sufficient for 80% power and in accordance with the 3R principles. Statistical calculations were performed using OriginPro software (OriginLab, USA).
Histological study
Microphotographs and graphs of cell counts for brain sections in CP and LSc zones are shown in Fig. 2. In the CP zone, the total number of neurons decreased in all groups expressing mutant FUS compared to WT, HSP70in, and HSP70out groups (Fig. 2E). However, in the FUS[ 1-359]/HSP70out group, the number of neurons was lower than in FUS[ 1-359] and FUS[ 1-359]/HSP70in groups.
Neurons with eosinophilic cytoplasm were found only in the CP zone at the histological study (Fig. 2F). Their number increased significantly in all FUS-expressing groups, reaching maximum values in FUS[ 1-359]/HSP70out group. In FUS[ 1-359] and FUS[ 1-359]/HSP70in groups, the number of neurons with eosinophilic cytoplasm decreased but remained higher than in the groups without aberrant FUS.
In contrast to the CP zone, in the LSc zone, the number of neurons did not decrease in all FUS-expressing groups compared to WT group (Fig. 2G). Such a decrease in the number of neurons was characteristic only for FUS[ 1-359]/HSP70out group. At the same time, the number of hyperchromic neurons in the LSc zone (Fig. 2H) was higher in all FUS-expressing groups compared to WT group. The smallest number of hyperchromic neurons was a feature in FUS[ 1-359]/HSP70in group, compared to FUS[ 1-359] and FUS[ 1-359]/HSP70out groups.
Microphotographs and graphs of cell counts for brain sections in the hippocampal region are shown in Fig. 3. In the SUBd (Fig. 3G), CA1 (Fig. 3H), and DG (Fig. 3J) zones, the number of hyperchromic neurons increased in all FUS-expressing groups compared to the WT, HSP70in, and HSP70out groups. However, in FUS[ 1-359]/HSP70in group, the number of hyperchromic neurons was lower than in FUS[ 1-359] and FUS[ 1-359]/HSP70out groups. In the CA3 zone, no statistically significant differences in hyperchromic neurons between groups were found (Fig. 3I).
Microphotographs and graphs of cell counts per field of view for brain sections in the amygdala region are shown in Fig. 4. In the BLAv (Fig. 4H), BLAa/BLAp (Fig. 4I), and CeL (Fig. 4J) zones, the total number of neurons decreased in the FUS[ 1-359] and FUS[ 1-359]/HSP70out groups compared to WT, HSP70in, and HSP70out groups. However, in FUS[ 1-359]/HSP70in group, a decrease in the number of neurons relative to WT group was only revealed in the CeL zone. In the LA zone (Fig. 4G), the pattern of changes at the graph is similar to changes in other amygdala zones, but only a slight decrease in the number of neurons in FUS[ 1-359] group compared to the WT group where the changes were statistically significant.
Immunofluorescent study
The results of IF study for the CP and LSc zones are shown in Fig. 5. In both zones, a decrease in the number of NeuN+ cells was observed in FUS[ 1-359] and FUS[ 1-359]/HSP70out groups. The level of NeuN+ cells in FUS[ 1-359]/HSP70in group was higher than in other FUS-expressing groups, while in the CP zone, it was comparable to WT group, and in the LSc zone, it was significantly lower than in WT group (Fig. 5C, 5D).
Fig. 6 shows the results of the IF study for hippocampal structures. In the DG and CA1 zones, the proportion of GFAP+ and the number of S100β+ cells increased significantly in FUS[ 1-359] and FUS[ 1-359]/HSP70out groups, and to a lesser extent in FUS[ 1-359]/HSP70in group compared to WT group (Fig. 6H, 6I, 6K, 6L). Minor differences in SYP expression were observed only between FUS-expressing groups (Fig. 6M).
In the CA1 zone, a sharp decrease in the NeuN+/DAPI+ ratio was noted (Fig. 6J) in FUS[ 1-359] and FUS[ 1-359]/HSP70out groups. In contrast, in FUS[ 1-359]/HSP70in group, this ratio was not only higher than in other FUS-expressing groups but also did not differ significantly from the WT group.
Fig. 7 shows the results of the IF study in the LA zone. In all FUS-expressing groups (FUS[ 1-359], FUS[ 1-359]/HSP70out, and FUS[ 1-359]/HSP70in), the number of NeuN+ cells was lower compared to WT group and groups with monoexpression of HSP70. At the same time, among the groups with mutant FUS, NeuN expression was higher in FUS[ 1-359]/HSP70in group and lower in FUS[ 1-359]/HSP70out group.
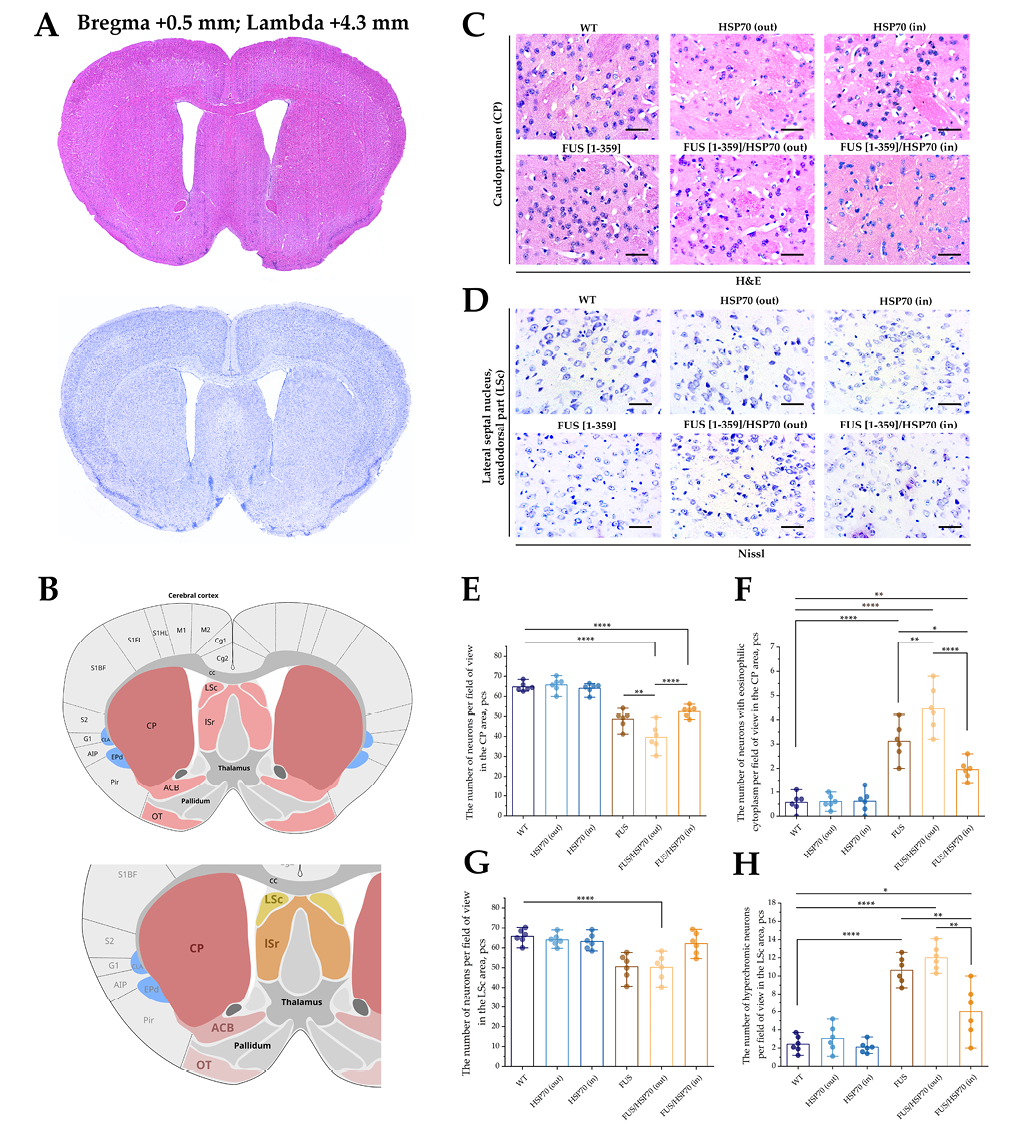
FIG. 2. Histological study of the caudoputamen and the caudal part of lateral septal nucleus in mice with FUS type of amyotrophic lateral sclerosis and overexpression of HSP70.
Note: * p < 0.05; ** p <0.01; **** p < 0.0001; HSP70 – 70 kDa heat shock proteins; FUS – fused in sarcoma protein; WT – wild type, control group; CP – caudoputamen; LSc – caudal part of the lateral septal nucleus.
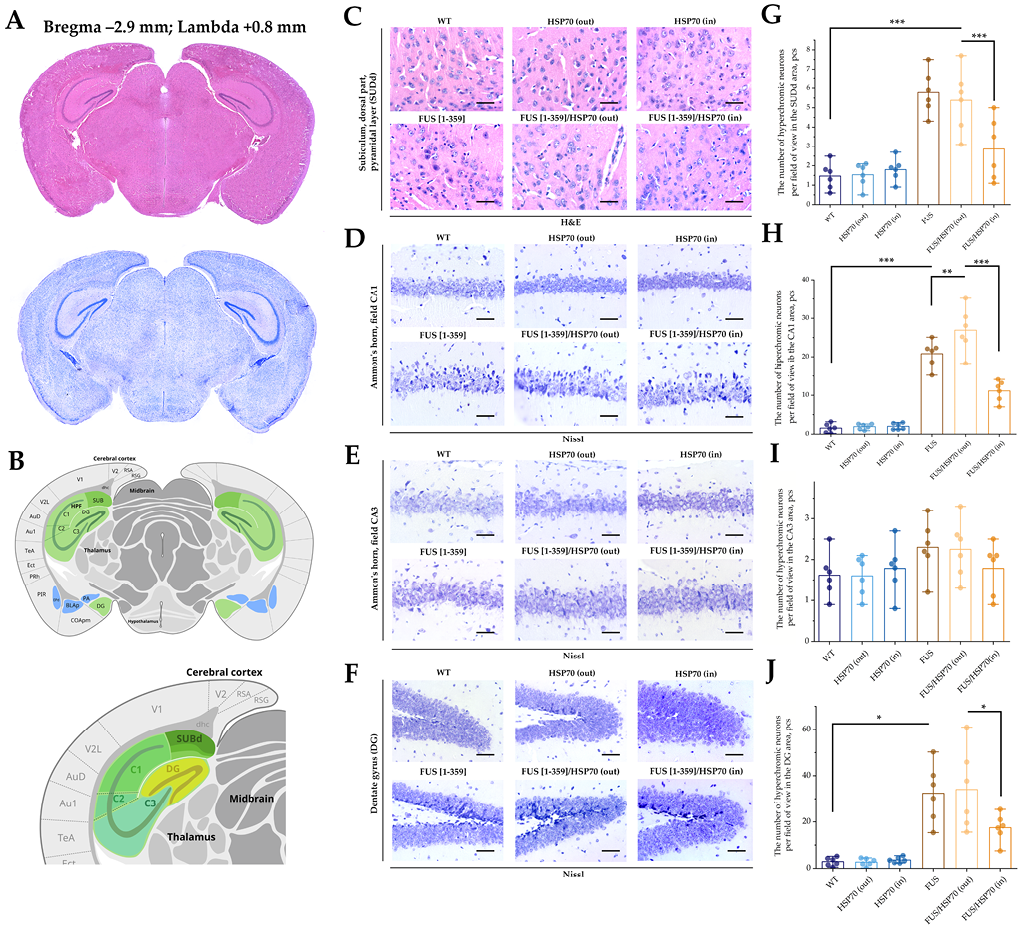
FIG. 3. Histological study of hippocampus in mice with FUS type of amyotrophic lateral sclerosis and overexpression of HSP70.
Note: * p < 0.05; ** p < 0.01; *** p < 0.001; HSP70 – 70 kDa heat shock proteins; FUS – fused in sarcoma protein; WT – wild type, control group; SUBd – subiculum; CA – cornu Ammonis; DG – dentate gyrus.
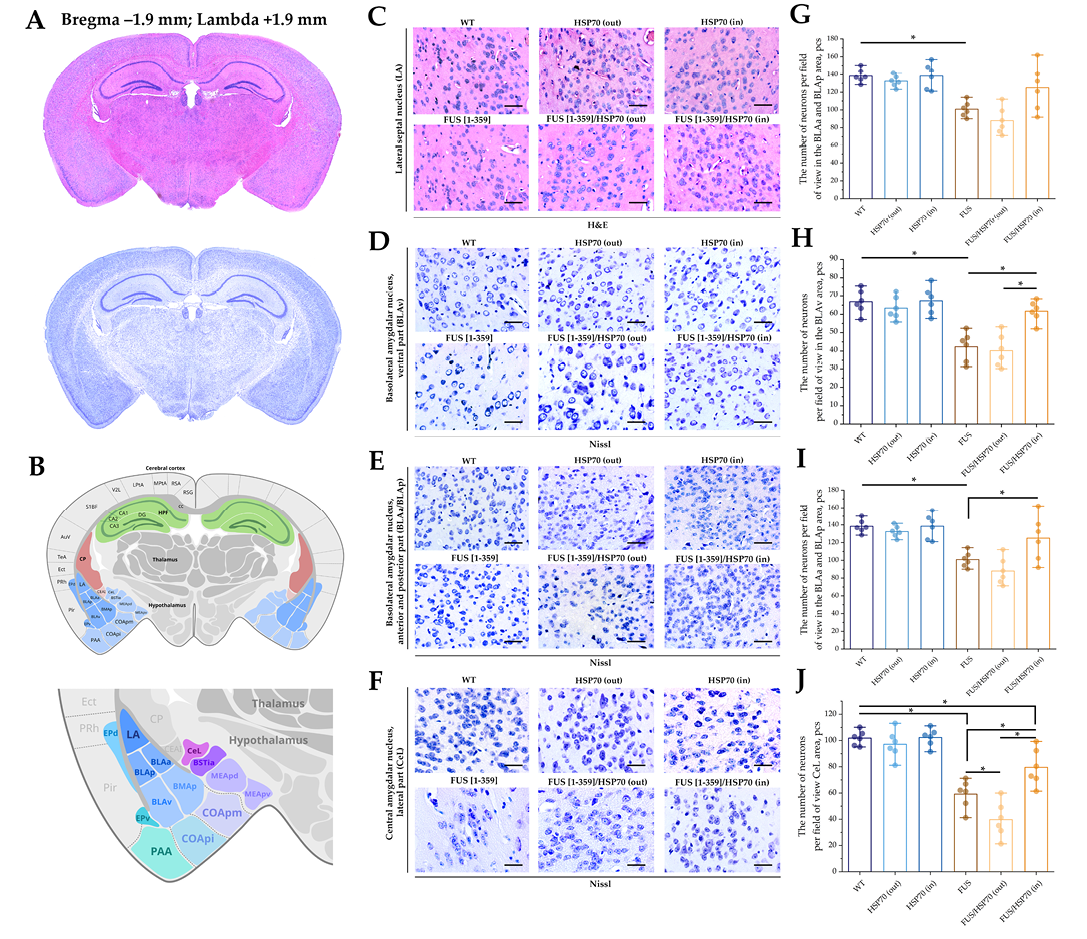
FIG. 4. Histological study of hippocampus in mice with FUS type of amyotrophic lateral sclerosis and overexpression of HSP70.
Note: * p < 0.05; HSP70 – 70 kDa heat shock proteins; FUS – fused in sarcoma protein; WT – wild type, control group; LA – lateral amygdalar nucleus; BLAv – basolateral amygdalar nucleus, ventral part; BLAa/BLAp – basolateral amygdalar nucleus, anterior and posterior parts; CeL – central amygdalar nucleus, lateral part.
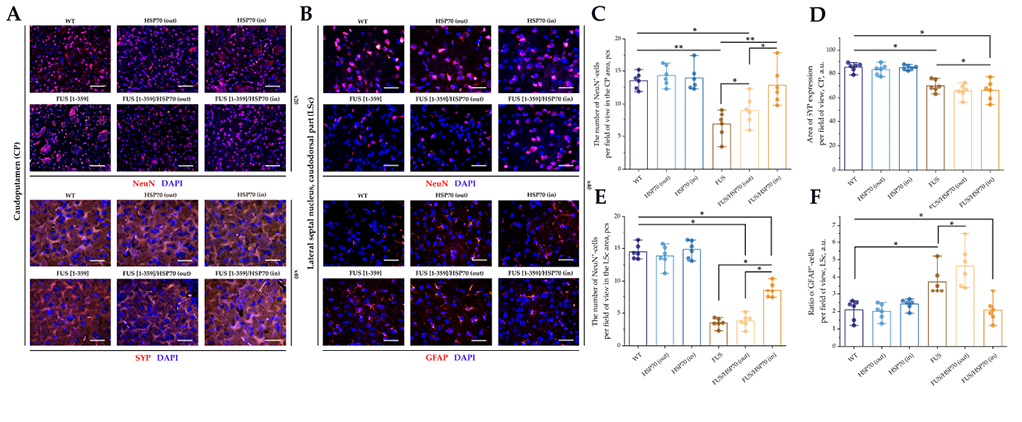
FIG. 5. Immunofluorescent study of caudoputamen and septal nuclei in mice with FUS type of amyotrophic lateral sclerosis and overexpression of HSP70.
Note: * p < 0.05; ** p < 0.01; HSP70 – 70 kDa heat shock proteins; FUS – fused in sarcoma protein; WT – wild type, control group; CP – caudoputamen; LSc – caudal part of the lateral septal nucleus; GFAP – glial fibrillary acidic protein; NeuN – neuronal nuclear marker; SYP – synaptophysin.
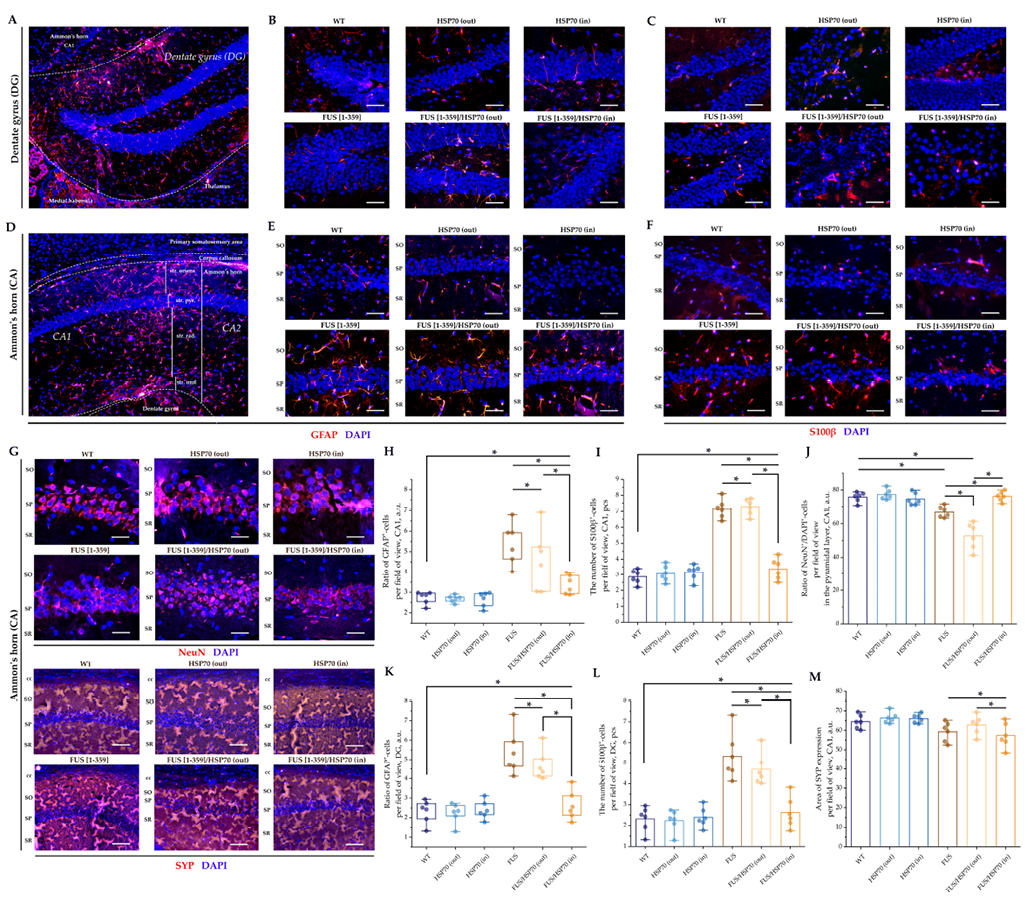
FIG. 6. Immunofluorescent study of hippocampal structure in mice with FUS type of amyotrophic lateral sclerosis and overexpression of HSP70.
Note: * p < 0.05; HSP70 – 70 kDa heat shock proteins; FUS – fused in sarcoma protein; WT – wild type, control group; DG – dentate gyrus; CA – Cornu Ammonis; GFAP – glial fibrillary acidic protein; NeuN – neuronal nuclear marker; SYP – synaptophysin.
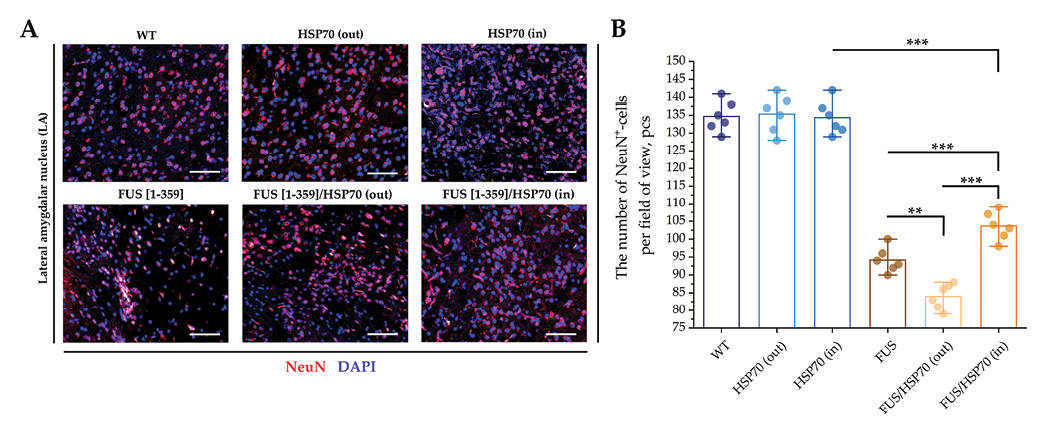
FIG. 7. Immunofluorescent study of amygdala in mice with FUS type of amyotrophic lateral sclerosis and overexpression of HSP70.
Note: ** p < 0.01; *** p < 0.001; HSP70 – 70 kDa heat shock proteins; FUS – fused in sarcoma protein; WT – wild type, control group; LA – lateral amygdalar nucleus; NeuN – neuronal nuclear marker.
A key component of this work was the appropriate selection of transgenic mouse lines expressing HSP70 and FUS. The ALS model line was chosen based on the following criteria: 1) a model with the effectiveness in developing pathological and clinical manifestations of the FUS variant of ALS is well studied and aberrant FUS expression is proven; 2) there are pronounced neurodegenerative manifestations; 3) the mice survive up to an age where they can be crossed with rodents of other lines to breed double transgenic animals [6][11]. The line expressing HSPA1A was chosen because this variant of HSP70 is capable of interacting with the FUS protein in its cytoplasmic mislocalization [14].
Our study revealed neurodegenerative changes in mutant FUS expression: a reduction in the number of neurons, an increase in the number of hyperchromic neurons, a decrease in NeuN expression and NeuN+/DAPI+ ratio, and co-expression of intracellular HSPA1A and mutant FUS in mice that is associated with lower levels of neurodegeneration. In the initial description of this ALS model, a neurodegenerative damage to brainstem structures was noted without specifying the nature of changes at the limbic system [11].
This study demonstrated a reduction in the number of neurons in the CP zone in all FUS-expressing animals. According to the literature, CP structures are susceptible to neurodegenerative changes in humans with FUS-associated ALS [15]. It has also been previously shown that electrical activity in the CP zone increases in mice expressing mutant FUS [16]. In this study, the animals with extracellular expression of HSPA1A (group FUS[ 1-359]/HSP70out) had neuronal survival in the CP even lower than in monotransgenic animals expressing mutant FUS (group FUS[ 1-359]), while in animals with intracellular expression (group FUS[ 1-359]/HSP70in), it was higher. Similar data were obtained for the number of cells with a positive reaction to NeuN, a known marker of mature neurons. Since the presence of excessive HSPA1A does not cause neurodegenerative changes in the CNS, as we had showed previously [9], it can be assumed that extracellular expression of HSPA1A exacerbates the pathological changes in the FUS variant of ALS. At the same time, co-expression of HSPA1A and FUS in the cytoplasm of CP neurons positively affects their survival.
In the CP zone, neurons with eosinophilic inclusions in the cytoplasm were also found, and their number increased in mutant FUS-expressing groups, especially in FUS[ 1-359]/HSP70out group. Similar “cherry spot” inclusions have previously been found in the nuclei of hippocampal neurons in the FUS variant of frontotemporal dementia [17]. A. Murakami et al. also reported the detection of FUS-positive inclusions in the striatum in autopsy material [18]. This finding may represent more evidence of FUS-associated neurodegenerative changes. However, there is insufficient experimental material for comparison to consider eosinophilic inclusions a specific marker.
For limbic system parts (septal nuclei, hippocampus) with a high concentration of neurons per unit area and, consequently, a higher probability of bias during comparison, the study considered not the total number of neurons, but the number of hyperchromic cells. This parameter is commonly used to assess neurodegenerative changes [19]. In the study of the LSc zone, the number of hyperchromic neurons, as well as cells expressing NeuN, increased in all FUS-expressing groups. These data are consistent with the general trend of changes in the CP zone, namely a more pronounced level of neurodegenerative changes in FUS[ 1-359] and FUS[ 1-359]/HSP70out groups compared to FUS[ 1-359]/HSP70in group. To date, no previous studies have been revealed in the accessible databases demonstrating changes in the number of neurons or hyperchromic neurons in the septal nuclei of animals expressing mutant FUS or in ALS-suffered humans.
In the hippocampal regions SUBd, CA1, and DG, this trend was maintained between the groups as described above for the CP and LSc zones. Thus, the number of hyperchromic neurons increased with mutant FUS expression, but in mice with simultaneous intracellular overexpression of HSPA1A (group FUS[ 1-359]/HSP70in) it was lower than in other mice expressing mutant FUS. These changes were accompanied by a decrease in NeuN expression in groups with mutant FUS, least pronounced in FUS[ 1-359]/HSP70in group. In the hippocampus, there was also an increase in the number of GFAP+ and S100β+ cells, and for these parameters, the differences between groups were consistent with the differences in the increase in the number of hyperchromic neurons. Since GFAP and S100β are markers of activated astrocytes, their increase may reflect the involvement of astroglia into FUS accumulation-driven reactions.
The hippocampus, due to its role in cognitive functions, is of particular interest in ALS. Its sensitivity to changes in FUS activity has been demonstrated in the study by Kino et al. [20]. In mice expressing mutant FUS, cognitive functions and spine formation in the hippocampus were reduced, although there was no cytoplasmic mislocalization of FUS in the hippocampus [21]. It has also been shown that spine density in the hippocampus and cognitive functions stay reduced in transgenic mice expressing mutant FUS and manifesting ALS [22]. However, in our study, no differences were found in the area of hippocampal tissue with a positive reaction to SYP. It is possible that synaptic function is less involved in FUS pathology in ALS than spine density.
An increase in FUS expression, neurodegenerative changes, and subsequent recovery of the number of neurons in a study investigating ischemic effects on the hippocampus were in some cases reported to be accompanied by a transient increase in HSP70 expression [23]. It can be assumed that HSP70 in the hippocampus helps to mitigate the negative effects of FUS accumulation (Fig. 8).
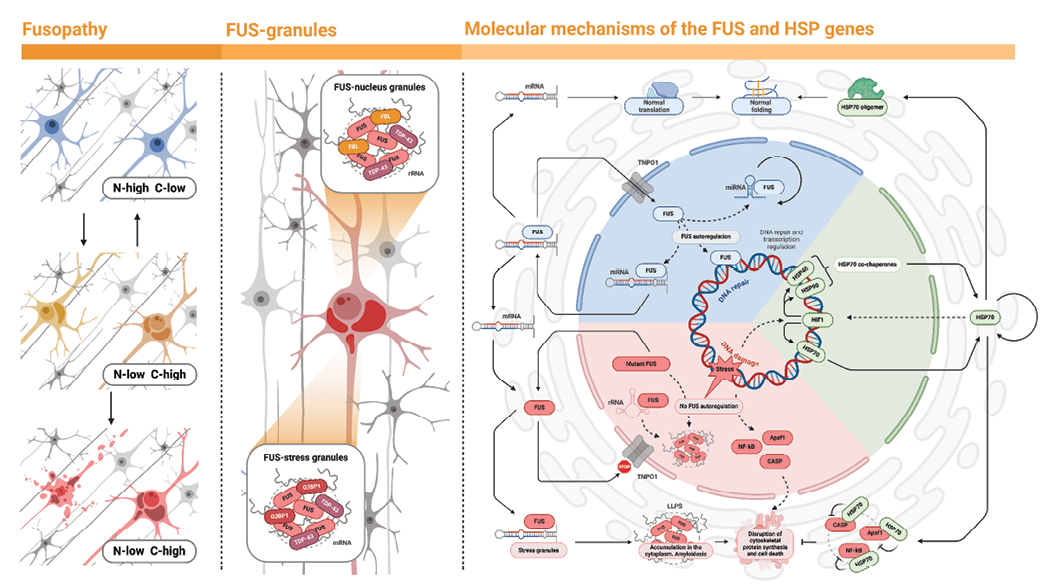
FIG. 8. Mechanisms of FUS-HSP70 interaction in cells.
Left: localization of fused-in-sarcoma (FUS) protein in the nucleus (blue). Loss of the nuclear localization signal leads to the migration of FUS into the cytoplasm (yellow). “N” – nucleus, “C” – cytoplasm.
Center: in the nucleus, FUS, together with fibrillarin (FBL) and the TDP-43 protein, binds rRNA to form nuclear granules. In the cytoplasm, stress granules containing mRNA with the G3BP1 marker are present. FUS in the cytoplasm associates with these granules.
Right: FUS activity (blue sector) supports DNA repair and transcriptional regulation, with autoregulation of FUS activity. FUS located outside the nucleus returns through the nuclear pore with the help of TNPO1 protein, while HSP70 chaperones ensure proper translation and folding. HSP70 activity (green sector) requires interaction with HSP40 and HSP90. Damage induces the synthesis of HSP70, for example through hypoxia-inducible factor 1 (HIF1). Stress-induced DNA damage can lead to mutations in the FUS gene. As a result, mutant FUS loses its nuclear localization signal. The accumulation of FUS in the cytoplasm and its aggregation disrupts liquid-liquid phase separation (LLPS) mechanisms, causing amyloidosis, and together with the activation of apoptosis (CASP; Apaf1; NF-κB) leads to impaired cytoskeleton repair and cell death.
In the amygdala, in most nuclei except the lateral nucleus, the number of neurons decreased in all FUS-expressing groups, but in FUS[ 1-359]/HSP70in group it was minimal. This is consistent with the trend observed in other studied parts of the limbic system. There is little data in the literature about amygdala involvement in ALS, but it has been reported that mutant FUS expression is absent in the amygdala in the FUS variant of ALS [24].
In addition, we have previously examined changes in the primary motor cortex and spinal cord in the same models [25]. In all cases, a reduction in neurodegenerative changes was demonstrated with simultaneous overexpression of the cytosolic form of HSPA1A and mutant FUS protein with cytoplasmic mislocalization.
Limitations of the study
Extrapolation of animal experiments to humans is limited. This study does not cover all areas of the central nervous system. For example, the diversity of cortical areas in humans is inherently greater, as mice lack gyri; mice do not have speech regulation parts in the brain, etc.
Further research perspectives
We assume that it is a challenging task to establish the molecular mechanisms contributing to the positive impact of HSP70 overexpression on slowing neurodegenerative manifestations in the FUS-related ALS. Recording electrical changes in limbic system structures will allow a more complete description of the double transgenic murine models.
In the present study, we explored quantitative parameters of neurodegenerative changes in the limbic system in mice with overexpression of HSP70 in the form of HSPA1A and co-expression of mutant human FUS[ 1-359] protein related to ALS manifestation. According to data obtained, the co-expression of HSPA1A protein together with the mutant FUS[ 1-359] in the cytoplasm of nervous tissue cells in the limbic system is accompanied by fewer neurodegenerative changes compared to the monoexpression of the mutant FUS. Moreover, pathological changes are most significantly reduced in co-expression of FUS and intracellular HSPA1A overexpressed with HSP70 secretion out of cells. This study indicates HSPA1A overexpression as a promising approach to slow the progression of FUS-related ALS.
Gennadii A. Piavchenko and Sergey L. Kuznetsov developed the idea and design of the study. Egor A. Kuzmin and Ksenia S. Pokidova carried out the experiments with animals, made histological slides, and provided statistical calculations. Artem A. Venediktov carried studied the literature sources and wrote a draft text of the article. Egor A. Kuzmin and Ksenia S. Pokidova designed graphical elements of the work. Gennadii A. Piavchenko and Sergey L. Kuznetsov edited the article. All authors approved the final version of the article.
Ethics statements. The study complies with the standards of the EU Directive for the Protection of the Vertebrate Animals used for Experimental and other Scientific Purposes. All manipulations with animals were approved by the Local Bioethics Committee of the Sechenov First Moscow State Medical University (Sechenov University), No. 04-23 from 02.03.2023.
Data availability. The data that support the findings of this study are available from the corresponding authors on reasonable request.
Conflict of interests. Sergey L. Kuznetsov is a member of the editorial board and did not participate in the editorial review or decisionmaking on this article.
Financing. The study was supported by the Russian Science Foundation, project No. 23-25-004481.
1 Project card of fundamental and exploratory scientific research supported by the Russian Science Foundation. Study of neuroimmunological effects of extracellular and intracellular HSP70 in neurodegenerative brain damage in mice https://rscf.ru/project/23-25-00448/ (accessed: December 1, 2024).
1. Feldman E.L., Goutman S.A., Petri S., et al. Amyotrophic lateral sclerosis. Lancet. 2022 Oct 15; 400(10360): 1363–1380. https://doi.org/10.1016/S0140-6736(22)01272-7. Epub 2022 Sep 15. PMID: 36116464
2. Shoesmith C. Palliative care principles in ALS. Handb Clin Neurol. 2023; 191: 139–155. https://doi.org/10.1016/B978-0-12-824535-4.00007-0. PMID: 36599506
3. Yun Y., Ha Y. CRISPR/Cas9-Mediated Gene Correction to Understand ALS. Int J Mol Sci. 2020 May 27; 21(11): 3801. https://doi.org/10.3390/ijms21113801. PMID: 32471232
4. Grad L.I., Rouleau G.A., Ravits J., et al. Clinical Spectrum of Amyotrophic Lateral Sclerosis (ALS). Cold Spring Harb Perspect Med. 2017 Aug 1; 7(8): a024117. https://doi.org/10.1101/cshperspect.a024117. PMID: 28003278
5. Kwiatkowski T.J. Jr, Bosco D.A., Leclerc A.L., et al. Mutations in the FUS/TLS gene on chromosome 16 cause familial amyotrophic lateral sclerosis. Science. 2009 Feb 27; 323(5918): 1205–1208. https://doi.org/10.1126/science.1166066. PMID: 19251627
6. Nolan M., Talbot K., Ansorge O. Pathogenesis of FUS-associated ALS and FTD: insights from rodent models. Acta Neuropathol Commun. 2016 Sep 6; 4(1): 99. https://doi.org/10.1186/s40478-016-0358-8. PMID: 27600654
7. Venediktov A.A., Bushueva O.Y., Kudryavtseva V.A., et al. Closest horizons of Hsp70 engagement to manage neurodegeneration. Front Mol Neurosci. 2023 Sep 19; 16: 1230436. https://doi.org/10.3389/fnmol.2023.1230436. PMID: 37795273
8. Li Y., Gu J., Wang C., et al. Hsp70 exhibits a liquid-liquid phase separation ability and chaperones condensed FUS against amyloid aggregation. iScience. 2022 May 5; 25(6): 104356. https://doi.org/10.1016/j.isci.2022.104356. PMID: 35620440
9. Piavchenko G.A., Venediktov A.A., Kuzmin E.A., et al. Morphofunctional features in mice treated by low and high Hsp70 doses. Sechenov Medical Journal. 2023; 14(4): 31–41. (In Russian). https://doi.org/10.47093/2218-7332.2023.918.13. EDN: WALXAM
10. Bede P., Iyer P.M., Schuster C., et al. The selective anatomical vulnerability of ALS: ‘disease-defining’ and ‘disease-defying’ brain regions. Amyotroph Lateral Scler Frontotemporal Degener. 2016 Oct-Nov; 17(7–8): 561–570. https://doi.org/10.3109/21678421.2016.1173702. PMID: 27087114
11. Shelkovnikova T.A., Peters O.M., Deykin A.V., et al. Fused in sarcoma (FUS) protein lacking nuclear localization signal (NLS) and major RNA binding motifs triggers proteinopathy and severe motor phenotype in transgenic mice. J Biol Chem. 2013 Aug 30; 288(35): 25266–25274. https://doi.org/10.1074/jbc.M113.492017. Epub 2013 Jul 18. PMID: 23867462
12. Paxinos G., Franklin K.B.J. The Mouse Brain in Stereotaxic Coordinates. 5th Edition. Academic Press. 2019. 376 p. eBook ISBN: 9780128161586
13. Bankhead P., Loughrey M.B., Fernández J.A, et al. QuPath: Opensource software for digital pathology image analysis. Sci Rep. 2017 Dec 4; 7(1): 16878. https://doi.org/10.1038/s41598-017-17204-5. PMID: 29203879
14. Gurskiy Y.G., Garbuz D.G., Soshnikova N.V., et al. The development of modified human Hsp70 (HSPA1A) and its production in the milk of transgenic mice. Cell Stress Chaperones. 2016 Nov; 21(6): 1055–1064. https://doi.org/10.1007/s12192-016-0729-x. PMID: 27511022
15. Mochizuki Y., Isozaki E., Takao M., et al. Familial ALS with FUS P525L mutation: two Japanese sisters with multiple systems involvement. J Neurol Sci. 2012 Dec 15; 323(1–2): 85–92. https://doi.org/10.1016/j.jns.2012.08.016. PMID: 22980027
16. Vorobyov V., Deev A., Sengpiel F., et al. Cortical and Striatal Electroencephalograms and Apomorphine Effects in the FUS Mouse Model of Amyotrophic Lateral Sclerosis. J Alzheimers Dis. 2021; 81(4): 1429–1443. https://doi.org/10.3233/JAD-201472. PMID: 33935079
17. Koga S., Murakami A., Soto-Beasley A.I., et al. Publisher Correction to: Diffuse argyrophilic grain disease with TDP43 proteinopathy and neuronal intermediate filament inclusion disease: FTLD with mixed tau, TDP-43 and FUS pathologies. Acta Neuropathol Commun. 2023 Jul 12;11(1):117. https://doi.org/10.1186/s40478-023-01621-x. Erratum for: Acta Neuropathol Commun. 2023 Jul 6; 11(1): 109. https://doi.org/10.1186/s40478-023-01611-z. PMID: 37438786
18. Murakami A., Nakamura M, Nakamura Y., et al. An autopsy case report of neuronal intermediate filament inclusion disease presenting with predominantly upper motor neuron features. Neuropathology. 2021 Oct; 41(5): 357–365. https://doi.org/10.1111/neup.12741. PMID: 34309938
19. Plekhova N.G., Radkov I.V., Zinoviev S.V., et al. Effect of Mild Traumatic Brain Injury on Behavioral Reactions and Neocortical Morphology in Rats. Bull Exp Biol Med. 2021 Mar;170(5):672– 676. https://doi.org/10.1007/s10517-021-05130-6. Epub 2021 Mar 31. PMID: 33788107
20. Kino Y., Washizu C., Kurosawa M., et al. FUS/TLS deficiency causes behavioral and pathological abnormalities distinct from amyotrophic lateral sclerosis. Acta Neuropathol Commun. 2015 Apr 25; 3: 24. https://doi.org/10.1186/s40478-015-0202-6. PMID: 25907258
21. Tzeplaeff L., Seguin J., Le Gras S., et al. Mutant FUS induces chromatin reorganization in the hippocampus and alters memory processes. Prog Neurobiol. 2023 Aug; 227: 102483. https://doi.org/10.1016/j.pneurobio.2023.102483. Epub 2023 Jun 15. PMID: 37327984
22. Ho W.Y., Agrawal I., Tyan S.H., et al. Dysfunction in nonsense-mediated decay, protein homeostasis, mitochondrial function, and brain connectivity in ALS-FUS mice with cognitive deficits. Acta Neuropathol Commun. 2021 Jan 6; 9(1): 9. https://doi.org/10.1186/s40478-020-01111-4. PMID: 33407930
23. Sun M., Yamashita T., Shang J., et al. Acceleration of TDP43 and FUS/TLS protein expressions in the preconditioned hippocampus following repeated transient ischemia. J Neurosci Res. 2014 Jan; 92(1): 54–63. https://doi.org/10.1002/jnr.23301. Epub 2013 Oct 28. PMID: 24265138
24. King A., Troakes C., Smith B., et al. ALS-FUS pathology revisited: singleton FUS mutations and an unusual case with both a FUS and TARDBP mutation. Acta Neuropathol Commun. 2015 Oct 9; 3: 62. https://doi.org/10.1186/s40478-015-0235-x. PMID: 26452761
25. Piavchenko G.A., Pokidova K.S., Kuzmin E.A., et al. Quantitative Immunofluorescence Mapping of HSP70’s Neuroprotective Effects in FUS-ALS Mouse Models. Appl. Sci. 2024; 14(24): 11614. https://doi.org/10.3390/app142411614
Gennadii A. Piavchenko - Cand. of Sci. (Medicine), Associate Professor, Human Anatomy and Histology Department.
8/2, Trubetskaya str., Moscow, 119048
Ksenia S. Pokidova - research intern, Human Anatomy and Histology Department.
8/2, Trubetskaya str., Moscow, 119048
Egor A. Kuzmin - research intern, Human Anatomy and Histology Department.
8/2, Trubetskaya str., Moscow, 119048
Artem A. Venediktov - postgraduate student, Assistant Professor, Human Anatomy and Histology Department.
8/2, Trubetskaya str., Moscow, 119048
Sergey L. Kuznetsov - Corresponding Member of RAS, Dr. of Sci. (Medicine), Professor, Human Anatomy and Histology Department.
8/2, Trubetskaya str., Moscow, 119048
|
|
1. Graphic abstract | |
| Subject | ||
| Type | Исследовательские инструменты | |
View
(192KB)
|
Indexing metadata ▾ | |

|
2. 1180_The ARRIVE guidelines 2.0: author checklist | |
| Subject | ||
| Type | Исследовательские инструменты | |
Download
(120KB)
|
Indexing metadata ▾ | |
Журнал "Сеченовский вестник". Лист редактора можно посмотреть здесь /
Sechenov Medical Journal. Editor's checklist you can find here
Название / Title | Гиперэкспрессия белков теплового шока HSP70 у мышей с мутантнымбелком FUS сопровождается меньшими нейродегенеративнымиизменениями в структурах лимбической системы / Overexpression of HSP70 in mice with mutant FUS protein is accompanied by a mitigated neurodegeneration in limbic system |
Раздел / Section
| КЛЕТОЧНАЯ БИОЛОГИЯ, ЦИТОЛОГИЯ, ГИСТОЛОГИЯ / CELL BIOLOGY, CITOLOGY, HISTOLOGY |
Тип / Article | Оригинальная статья / Original article |
Номер / Number | 1180 |
Страна/территория / Country/Territory of origin | Россия / Russia |
Язык / Language | Русский / Russian |
Источник / Manuscript source | Инициативная рукопись / Unsolicited manuscript |
Дата поступления / Received | 01.12.2024 |
Тип рецензирования / Type ofpeer-review | Двойное слепое / Double blind |
Язык рецензирования / Peer-review language | Русский / Russian
|
РЕЦЕНЗЕНТ А / REVIEWER A
Инициалы / Initials | 1180_А |
Научная степень / Scientific degree | Кандидат медицинских наук / Cand. of Sci. (Medicine) |
Страна/территория / Country/Territory | Россия / Russia |
Дата рецензирования / Date of peer-review | 26.02.2025 |
Число раундов рецензирования / Number of peer-review rounds | 1 |
Финальное решение / Final decision | принять к публикации / accept |
ПЕРВЫЙ РАУНД РЕЦЕНЗИРОВАНИЯ / FIRST ROUND OF PEER-REVIEW
Актуальность цели исследования не вызывает сомнений. Боковой амиотрофический склероз, является заболеванием нервной системы, которое поражает нервные клетки в головном и спинном мозге. Состояние пациентов ухудшается с течением времени. Точная причина заболевания до сих пор неизвестна, однако, примерно у 10% людей с боковым амиотрофическим склерозом (БАС) можно определить генетическую причину с большим количеством вовлеченных генов. При этом достаточно многочисленные недавние генетические открытия предполагают, что наследственные формы БАС более распространены, чем считалось ранее.
В настоящее время не существует эффективного лечения или лечения, которое может обратить вспять ущерб, вызванный БАС. Накопленные научные данные, пока, не позволяют излечивать это смертельное заболевание.
БАС считается мультисистемным расстройством, которое может сопровождаться немоторными симптомами, такими как поведенческие и когнитивные нарушения, и даже проявляться как перекрестный синдром с признаками лобно-височной деменции (ЛВД), обнаружено, что анатомические и функциональные поражения при БАС выходят за рамки прецентральной коры и кортикоспинальных трактов, могут включать мозолистое тело, лобную, сенсорную и премоторную кору, таламус и другие отделы головного мозга. Поэтому морфологические исследования структур лимбической системы на трансгенных животных моделях заболевания, несомненно, актуальны.
Научная новизна результатов не вызывает сомнений. Получены количественные показатели нейродегенеративных изменений в структурах лимбической системы у мышей с гиперэкспрессией белков теплового шока семейства HSP70 в форме HSPA1A и экспрессией мутантного человеческого белка FUS с транслокацией [1-359], свойственной для БАС. Обнаружено, что одновременное присутствие белка HSPA1A вместе с мутантным белком FUS [1-359] в цитоплазме клеток нервной ткани в структурах лимбической системы сопровождается меньшими нейродегенеративными изменениями, чем при изолированной экспрессии мутантного FUS.
Практическая значимость результатов высокая, так как продемонстрированы определенные патологические изменения в лимбической системе в трансгенной животной модели БАС, а также сделано обоснованное предположение, что гиперэкспрессия HSPA1A является потенциальным способом замедлить развитие FUS-варианта БАС. Результаты расширяют представления о возможностях лечения БАС, терапевтического использования белков теплового шока и стратегий влияния на их экспрессию.
Статья соответствует правилам этики проведения исследований и публикации их результатов. Материалы и методы исследований соответствуют поставленной цели. За последнее десятилетие область изучения БАС значительно продвинулась вперед благодаря быстрому прогрессу в понимании генетической архитектуры и патофизиологических механизмов заболевания за счет разработки надежных, пригодных для использования доклинических модельных систем. Двойные трансгенные мыши в исследовании – свидетельство самого современного и высокого уровня техники при выполнении исследования.
Заключение обоснованно и не противоречит известным представлениям о БАС и адекватных животных моделях этого заболевания. Использование научной терминологии и ее соответствие принятой в рассматриваемой области знаний не вызывают замечаний.
Валидность и новизна выбранных литературных источников не вызывают возражений. Можно учесть информацию Mead, R.J., Shan, N., Reiser, H.J. et al. Amyotrophic lateral sclerosis: a neurodegenerative disorder poised for successful therapeutic translation. Nat Rev Drug Discov 22, 185–212 (2023). https://doi.org/10.1038/s41573-022-00612-2.
Целостность и непротиворечивость текста работы, стиль изложения и уровень русского языка – без замечаний.
РЕЦЕНЗЕНТ B / REVIEWER B
Инициалы / Initials | 1180_В |
Научная степень / Scientific degree | Доктор медицинских наук / Dr. of Sci. (Medicine) |
Страна/территория / Country/Territory | Россия / Russia |
Дата рецензирования / Date of peer-review | 01.03.2025 |
Число раундов рецензирования / Number of peer-review rounds | 1 |
Финальное решение / Final decision | принять к публикации / accept |
ПЕРВЫЙ РАУНД РЕЦЕНЗИРОВАНИЯ / FIRST ROUND OF PEER-REVIEW
Актуальность исследования и научная новизна его результатов не вызывает сомнений.
Работа проведена в соответствии с правилами этики проведения исследований и публикации их результатов. Материалы и методы соответствуют поставленной цели. Заключение достаточно обосновано.
Замечания (пожелания):
Рис 2. – Как правило, схематичное (графическое) отображение дизайна исследования является необходимым в научном докладе или тексте диссертационного исследования. В данном случае – это научная статья и демонстрируемый графический материал является лишним (учитывая наличие всей информации в тексте рубрики «материалы и методы») и избыточным. Рекомендуется удалить данный рисунок из текста научной статьи.

8-2 Trubetskaya st., Moscow, 119048
Federal State Autonomous Educational Institution of Нigher Education I.M.Sechenov First Moscow State Medical University of the Ministry of Health of the Russian Federation (Sechenovskiy University)
E-mail: sechenovmedj@staff.sechenov.ru
Processing of personal data


