


Contents
Scroll to:
 A. A. Dyachenko,
A. M. Grjibovski,
M. A. Bogdanov,
D. V. Bogdanov,
E. A. Nazarova,
A. A. Meldo,
V. Yu. Chernina,
M. G. Belyaev,
V. A. Gombolevsky,
M. Yu. Valkov
A. A. Dyachenko,
A. M. Grjibovski,
M. A. Bogdanov,
D. V. Bogdanov,
E. A. Nazarova,
A. A. Meldo,
V. Yu. Chernina,
M. G. Belyaev,
V. A. Gombolevsky,
M. Yu. Valkov https://doi.org/10.47093/2218-7332.2025.16.2.4-17
Scroll to:
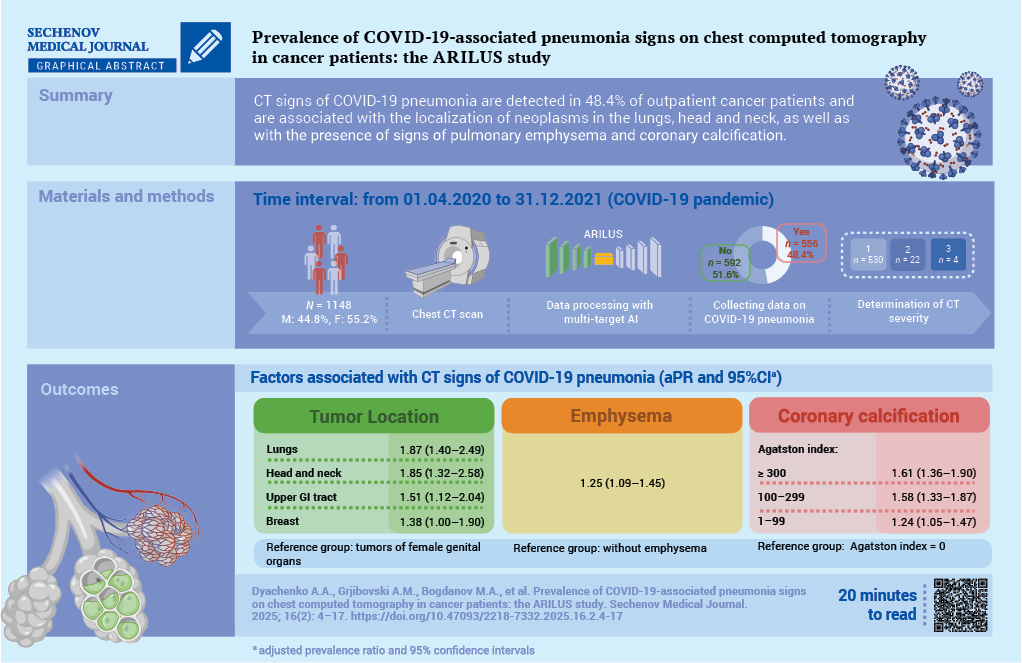
Aim. To study the prevalence of pneumonia features associated with 2019 coronavirus disease (COVID-19) in cancer patients based on chest computed tomography (CT) data using an artificial intelligence (AI) algorithm.
Materials and methods. A cross-sectional study was conducted as part of the ARILUS project. Using multitarget AI, CT images of 1148 patients examined at the Arkhangelsk Clinical Oncology Dispensary from 01.04.2020 to 31.12.2021 were analyzed. Patients were divided into groups: without signs of pneumonia (n = 592, 51.6%) and with signs of pneumonia (n = 556, 48.4%). In 95.3% of patients with pneumonia, the lesion volume was less than 25% (CT-1). Using multivariate Poisson regression, adjusted prevalence ratios (aPR) with 95% confidence intervals (CI) were calculated.
Results. For demographic characteristics such as gender, age, place of residence, no relationship with the presence of signs of COVID-19 pneumonia was established. Topography of neoplasm is associated with the presence of signs of COVID-19 pneumonia (reference group – cancers of the female genital organs): lung cancer – aPR 1.87; 95% CI: 1.40–2.49; head and neck cancers – aPR 1.85; 95% CI: 1.32–2.58; upper gastrointestinal tract – aPR 1.51; 95% CI: 1.12–2.04; breast cancer – aPR: 1.38; 95% CI: 1.00–1.90; p < 0.01. The presence of pulmonary emphysema is associated with signs of COVID-19 pneumonia: aPR 1.25; 95% CI: 1.09–1.45, p = 0.002. With an increase in the Agatston score (AS) reflecting coronary artery calcification (reference group absence of calcification), the association with the presence of signs of COVID-19 pneumonia increased – for AS 1–99: aPR 1.24; 95% CI: 1.05–1.47; AS 100– 299: aPR 1.58; 95% CI: 1.33–1.87; AS 300 and above: aPR 1.61; 95% CI: 1.36–1.90; p < 0.001 for a linear trend.
Conclusion. Factors associated with the detection of COVID-19 pneumonia among cancer patients include the localization of neoplasms in the lungs, head and neck organs, upper gastrointestinal tract, breast, and as well as the presence of signs of emphysema and coronary calcification according to CT data
The 2019 coronavirus disease (COVID-19) pandemic significantly affected the diagnosis and treatment of malignant neoplasms (MN). During the pandemic, a substantial decline in global MN incidence rates was observed [1][2], including in the Russian Federation [3], primarily due to quarantine measures. Breast and cervical cancer screening programs, along with other cancer screenings, were suspended during the pandemic and later gradually resumed with scheduled visit intervals to reduce staff density and enhance infection control protocols [4]. In the Arkhangelsk region, the decrease in MN incidence during the COVID-19 pandemic was largely attributed to reduced detection of early-stage cervical, lung, and colorectal cancers [5].
Compared to other visualization methods, chest computed tomography (CT) has one of the highest sensitivity rates in detecting lung abnormalities associated with COVID-19 pneumonia. CT can identify characteristic lung changes in COVID-19 patients even before positive laboratory test results are obtained [6]. Meanwhile, artificial intelligence (AI) algorithms enable highly accurate detection of minimal lung changes on CT scans in asymptomatic and mild COVID-19 cases that do not require hospitalization. An independent evaluation of one such algorithm, developed by IRA Labs LLC (Moscow, Russia), demonstrated high diagnostic performance in detecting COVID-19 pneumonia signs: Receiver Operating Characteristic Area Under the Curve (ROC AUC) – 0.98, sensitivity – 0.95, specificity – 0.94, and accuracy – 0.94 [7].
During the COVID-19 pandemic, population-based cancer registries (PBCRs), with their large sample sizes and broad population coverage, were well-suited for monitoring shifts in cancer stage distribution at initial diagnosis and survival analysis. However, challenges arose in determining the exact stage at diagnosis due to delays in surgical interventions and pathological assessments. Given that chest CT scans were frequently performed for MN patients during outpatient visits and hospitalizations in the COVID-19 era, signs of pneumonia—including clinically silent cases – could also be tracked.
The Arkhangelsk Regional and Nenets Autonomous Okrug (NAO) Cancer Registry was established in 1998 and has maintained satisfactory completeness in recording and tracking MN patients from initial diagnosis to outcome since 2000. Data on deceased MN patients are updated monthly by cross-referencing mortality records from the Arkhangelsk Regional Medical Information and Analytical Center with the registry database. The registry’s completeness, accuracy, and timeliness have undergone multiple international audits, including within the “Cancer on Five Continents”, CONCORD, and VENUSCANCER programs [8–10]. The registry also contains codes for the immediate causes of death in cancer patients, enabling the estimation of cancer-specific survival and non-cancer mortality rates.
Study objective: to assess the prevalence of COVID-19-associated pneumonia signs in a population-based cohort of MN patients using AI-assisted chest CT analysis.
A cross-sectional study was conducted as part of the Arkhangelsk Research on the Impact of Multitarget Artificial Intelligence for Computed Tomography on Reducing Non-Cancer Lethal Outcomes in Patients with Malignant Neoplasms (ARILUS) project [11].
To achieve the study’s objective, all chest CT scan series from the central medical imaging archive of the Arkhangelsk Clinical Oncology Dispensary (AСOD) were extracted for the period from April 1, 2020, to December 31, 2021, corresponding to the COVID-19 pandemic.
Chest CT scans during this period were performed for two main indications: routine diagnostic workup and staging of MN; exclusion of viral pneumonia signs in hospitalized patients who developed COVID-19 symptoms (at admission, all patients were required to have no respiratory symptoms and a negative nasopharyngeal/oropharyngeal swab test for COVID-19). A total of 11,173 CT scans were performed during this period, of which 3533 were conducted for healthcare workers or private-pay patients without MN.
Selection of valid images for processing was performed considering AI algorithm limitations, specifically excluding cases with lung atelectasis based on radiologists’ interpretation reports, contrast-enhanced CT series based on DICOM tag analysis (ProtocolName Tag 0018,1030).
After deidentification, all valid CT series were sent for analysis by IRA Labs LLC (Moscow, Russia) AI system. At this stage, cases with severe motion artifacts, slice thickness >1.5 mm and incomplete lung scanning area were excluded. The total number of patients with valid CT studies was 1542.
After processing all images by the AI algorithm, they were sent via secure channel to ACOD using the key – insurance number of individual personal account (INIPA), and merged with the database of PBCR of Arkhangelsk Region and NAO, extracted on 15.04.2024. The total PBCR database contained information on 137,773 patients registered with MN diagnosis at the data extraction date, with INIPA data available for 62,988 patients. INIPA data in PBCR of Arkhangelsk Region and NAO have been recorded since January 1, 2021 for all newly registered patients, and during 2021 INIPA numbers were added for follow-up category patients. For the entire registration period (01.01.2000–15.04.2024), completeness of INIPA data was 45.7%. Data extraction from PBCR was necessary to establish causes of death in patients with available INIPA data. Among patients with valid CT studies, 394 had cancer but their INIPA data were unavailable, making outcome assessment impossible (the ARILIS study part on outcome assessment is considered separately and will be presented independently). Patients without INIPA data were excluded from the study.
The final analysis included 1148 patients (Fig. 1).
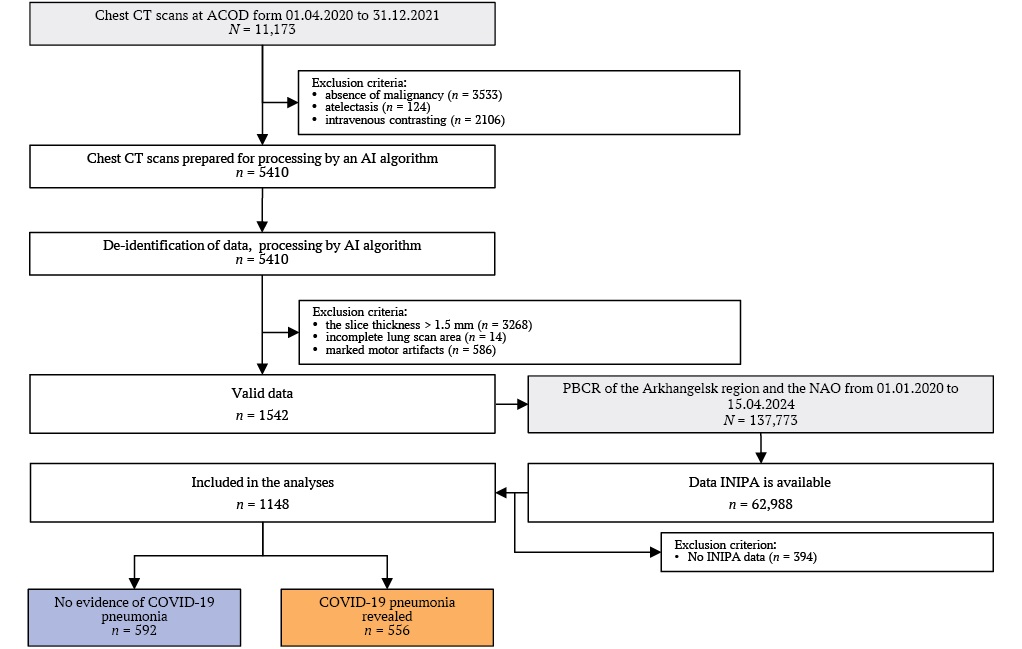
FIG. 1. Flowchart of the study.
Note: ACOD – Arkhangelsk Clinical Oncological Dispensary; AI – artificial intelligence; CT – computed tomography; INIPA – insurance number of individual personal account; NAO – Nenets Autonomous Okrug; PBCR – population–based cancer registry.
The combined database for analysis included the following variables: patient identification code, INIPA, age at the time of CT scan, sex, type of residential locality (urban/rural), MN diagnosis code under the International Classification of Diseases, 10th Revision (ICD-10). The data for all the variables for the study period were 100 per cent complete.
To detect qualitative and quantitative (percentage of lung involvement) infiltrative changes characteristic of COVID-19 viral pneumonia (classified as U07 under ICD-10) [12], we used a medical AI-based software developed by IRA Labs LLC (Moscow, Russia): “Software for CT Scan Analysis Using AI Technology ‘Intelligent Radiology Assistants’”, Technical Specifications (TU): 58.29.32-001-44270315-2021, Registration Certificate (Roszdravnadzor): No. RZN 2024/228951 (Fig. 2).
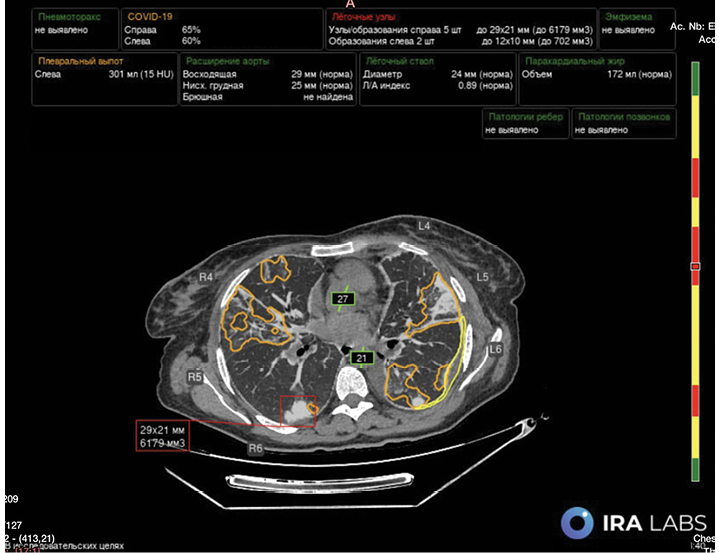
FIG. 2. Processing of chest computed tomography images using multi-target artificial intelligence technology.
Note: Lung tissue lesions of COVID-19 – associated pneumonia (orange) are presented as percentages for each lung. Also highlighted are lung nodules (red), their size and volume, fluid in the pleural cavity (yellow), its volume and densitometric density units, and vessel diameters (green).
Depending on the presence or absence of signs of pneumonia associated with COVID-19, all patients included in the database (n = 1148) were divided into two groups: without signs of pneumonia (n = 592, 51.6%) and with signs of pneumonia (n = 556, 48.4%). Notably, in most patients in the second group – 530 (95.3%) – the lesion volume was less than 25% (CT-1), signs of moderate (CT-2) and moderate (CT-3) pneumonia were found in 22 (4%) and 4 (0.7%) patients.
The AI-based software utilized in this study features a multitarget algorithm, enabling concurrent assessment of pulmonary emphysema, aortic and pulmonary trunk diameters, coronary artery calcification, bone mineral density of thoracic vertebrae (Fig. 2).
For ease of analysis and interpretation, all variables were categorized as ordinal (age, coronary artery calcification, bone mineral density), nominal (ICD-10 diagnosis codes/MN groups), binomial (sex, pulmonary emphysema, aortic aneurysm/dilation, pulmonary trunk dilation). Frequency distribution comparisons were performed using Pearson’s chi-square test.
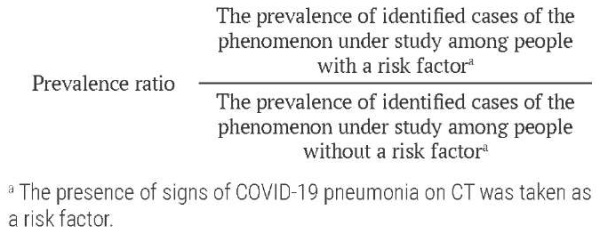
Association strength was quantified through unadjusted (univariate) and adjusted (multivariate) prevalence ratios (PR) with 95% confidence intervals (CI). PR was calculated using Poisson regression (both univariate and multivariate forms) with the standard formula. This approach was selected over logistic regression to avoid overestimation of effect measures given the high prevalence of the outcome variable. Only predictor variables showing an association with CT-detectable pneumonia signs at significance level (p) less than 0.15 in preliminary analyses were retained in the final adjusted model.
The reference categories included age below 40 years, urban residence, absence of signs of pulmonary emphysema, aortic dilation and osteoporosis, MNs of the female genital organs (ICD-10 codes C51–58), as well as absence of signs of coronary artery calcification. For the rank variables, the significance level for the linear trend was calculated by including the categories listed in the table as continuous variables.
In all statistical procedures, the critical significance level (p) was set at 0.05.
Statistical analysis was performed using Stata v.18 (Stata Corp., TX, USA).
The distribution of characteristics by study groups is presented in Table 1.
Table 1. Characteristics of the groups
|
Feature |
Total (n = 1148) |
No evidence of COVID-19 pneumonia (n = 592) |
COVID-19 pneumonia (n = 556) |
p-value |
|
Sex |
||||
|
female |
634 (55.2) |
374 (63.2) |
260 (46.8) |
<0.001 |
|
male |
514 (44.8) |
218 (36.8) |
296 (53.2) |
|
|
Age, years |
||||
|
0–39 |
43 (3.8) |
27 (4.6) |
16 (2.9) |
0.002 |
|
40–49 |
115 (10) |
72 (12.2) |
43 (7.7) |
|
|
50–59 |
236 (20.6) |
126 (21.3) |
110 (19.8) |
|
|
60–69 |
456 (39.7) |
238 (40.2) |
218 (39.2) |
|
|
70–79 |
250 (21.8) |
113 (19.1) |
137 (24.6) |
|
|
80 and older |
48 (4.1) |
16 (2.6) |
32 (5.8) |
|
|
Place of residence |
||||
|
urban |
860 (74) |
457 (72.5) |
403 (74.9) |
n.s. |
|
rural |
288 (26) |
135 (27.5) |
153 (25.1) |
|
|
ICD-10 codes, cancers |
||||
|
С51–58, Malignant neoplasms of female genital organs |
122 (10.6) |
80 (13.5) |
42 (7.6) |
<0.001 |
|
С0–14, С30–32, Head and neck cancers |
47 (4.1) |
19 (3.2) |
28 (5.0) |
|
|
С15, С16, Upper GIT cancers |
140 (12.2) |
60 (10.1) |
80 (14.4) |
|
|
С18–25, Lower GIT cancers |
238 (20.7) |
148 (25.0) |
90 (16.2) |
|
|
С34, Lung cancer |
185 (16.1) |
55 (9.3) |
130 (23.4) |
|
|
С43–49, Skin and soft tissues cancer |
74 (6.5) |
37 (6.3) |
37 (6.6) |
|
|
С50, Breast cancer |
151 (13.2) |
79 (13.3) |
72 (13.0) |
|
|
С61, Prostate cancer |
50 (4.4) |
29 (4.9) |
21 (3.7) |
|
|
С64–68, Urinary system cancers |
76 (6.6) |
39 (6.6) |
37 (6.7) |
|
|
other neoplasms |
65 (5.6) |
46 (7.8) |
19 (3.4) |
|
|
Lung emphysema |
||||
|
no |
1064 (92.7) |
574 (97.0) |
490 (88.1) |
<0.001 |
|
revealed |
84 (7.3) |
18 (3.0) |
66 (11.9) |
|
|
Aortal aneurism |
||||
|
no |
1125 (98.4) |
581 (98.6) |
544 (98.2) |
n.s. |
|
revealed |
18 (1.6) |
8 (1.4) |
10 (1.8) |
|
|
Aortal dilation |
||||
|
no |
777 (68.0) |
426 (72.3) |
351 (63.4) |
0.001 |
|
revealed |
366 (32.0) |
163 (27.7) |
203 (36.6) |
|
|
Pulmonary trunk dilation |
||||
|
no |
627 (65.8) |
305 (67.8) |
322 (64.0) |
n.s. |
|
revealed |
326 (34.2) |
145 (32.2) |
181 (36.0) |
|
|
Coronary artery calcification, Agatston index |
||||
|
0 |
518 (47.3) |
321 (57.6) |
197 (36.5) |
<0.001 |
|
1–99 |
264 (24.1) |
133 (23.9) |
131 (24.3) |
|
|
100–299 |
139 (12.7) |
48 (8.6) |
91 (16.9) |
|
|
300 and more |
175 (16.0) |
55 (9.9) |
120 (22.3) |
|
|
Osteoporosis, osteopenia |
||||
|
no |
355 (32.3) |
201 (35.5) |
154 (28.8) |
<0.05 |
|
osteopenia |
428 (38.9) |
214 (37.9) |
214 (40.0) |
|
|
osteoporosis |
317 (28.8) |
150 (26.6) |
167 (31.2) |
Notes: Data are presented as the absolute number of patients with the symptom and the proportion in the group expressed as a percentage (in parentheses). Pathological signs of aortic aneurysm/dilation, pulmonary trunk dilation, coronary calcification, and osteopenia were not assessed in all CT series due to either incomplete organ visualization or algorithm limitations.
COVID-19 – Coronavirus Disease 2019; CT – computed tomography; GIT – gastrointestinal tract; ICD-10 – International Classification of Diseases 10th Revision; n.s. – not significant.
In the analyzed cohort, sex distribution was approximately equal, while CT signs of pneumonia were detected significantly more frequently in men than women. The distribution of age categories was skewed towards older age groups in patients with COVID-19 pneumonia (Table 1).
In the study population, the most common tumor sites were the lower gastrointestinal tract (GIT) (20.7%), lung cancer (16.1%), breast cancer (13.2%), and upper GIT cancer (12.2%). The frequency of pneumonia detection varied significantly depending on cancer location: the highest rate was observed in lung cancer patients (70.3%), followed by head and neck malignancies (59.6%) and upper GIT cancers (57.1%). In patients with skin and soft tissue malignancies, the frequency of COVID-19 pneumonia was 50%; breast cancer (47.7%), urinary tract (48.7%), prostate cancer (42%), lower GIT (37.8%), female genital tract (34.4%), and other sites (29.2%) (Table 1).
Indicators of cardiovascular and pulmonary pathology, as well as signs of osteoporosis detected by AI-based multitarget CT analysis, were unevenly distributed. Signs of pulmonary emphysema, aortic dilation, presence and severity of coronary artery calcification, and osteoporosis were more prevalent in the group with COVID-19 pneumonia. However, no significant differences were found between the two groups in the distribution of aortic aneurysm/dilation and pulmonary trunk dilation.
The results of univariate and multivariate Poisson regression analyses are presented in Table 2.
Table 2. Association between COVID-19 pneumonia and studied characteristics
|
Feature |
cPR with 95% CI |
p-value |
aPR with 95% CI |
p-value |
|
Sex |
||||
|
female |
1.00 (ref.) |
<0.001a |
1.00 (ref.) |
n.s. |
|
male |
1.40 (1.25–1.58) |
1.15 (0.98–1.35) |
||
|
Age, years |
||||
|
0–39 |
1.00 (ref.) |
<0.001 |
1.00 (ref.) |
n.s.a |
|
40–49 |
1.00 (0.64–1.58) |
0.87 (0.56–1.36) |
||
|
50–59 |
1.25 (0.83–1.89) |
0.86 (0.56–1.30) |
||
|
60–69 |
1.28 (0.86–1.92) |
0.80 (0.53–1.21) |
||
|
70–79 |
1.47 (0.98–2.21) |
0.95 (0.63–1.45) |
||
|
80 and older |
1.79 (1.16–2.77) |
1.09 (0.69–1.71) |
||
|
Place of residence |
||||
|
urban |
1.00 (ref.) |
n.s. |
1.00 (ref.) |
n.s. |
|
rural |
1.13 (1.00–1.29 ) |
1.06 (0.93–1.20) |
||
|
ICD-10 codes, cancers |
||||
|
С51–58, Malignant neoplasms of female genital organs |
1.00 (ref.) |
<0.001 |
1.00 (ref.) |
<0.001 |
|
С0–14, С30–32, Head and neck cancers |
1.73 (1.23–2.43 ) |
1.85 (1.32–2.58) |
||
|
С15, С16, Upper GIT cancers |
1.66 (1.25–2.20 ) |
1.51 (1.12–2.04) |
||
|
С18–25, Lower GIT cancers |
1.10 (0.82–2.47 ) |
1.06 (0.78–1.45) |
||
|
С34, Lung cancer |
2.04 (1.57–2.65 ) |
1.87 (1.40–2.49) |
||
|
С43–49, Skin and soft tissues cancer |
1.45 (1.04–2.03 ) |
1.40 (0.99–1.93) |
||
|
С50, Breast cancer |
1.39 (1.03–1.86 ) |
1.38 (1.00–1.90) |
||
|
С61, Prostate cancer |
1.22 (0.81–1.83 ) |
1.07 (0.70–1.63) |
||
|
С64–68, Urinary system cancers |
1.41 (1.01–1.98 ) |
1.39 (0.98–1.98) |
||
|
other neoplasms |
0.85 (0.54–1.33 ) |
0.78 (0.48–1.25) |
||
|
Lung emphysema |
||||
|
no |
1.00 (ref.) |
<0.001 |
1.00 (ref.) |
0.002 |
|
revealed |
1.71 (1.50–1.94 ) |
1.25 (1.09–1.45) |
||
|
Aortal dilation |
||||
|
no |
1.00 (ref.) |
<0.001 |
1.00 (ref.) |
n.s. |
|
revealed |
1.23 (1.09–1.38 ) |
0.96 (0.85–1.10 ) |
||
|
Coronary artery calcification, Agatston index |
||||
|
0 |
1.00 (ref.) |
<0.001a |
1.00 (ref.) |
<0.001a |
|
1–99 |
1.30 (1.11–1.54 ) |
1.24 (1.05–1.47) |
||
|
100–299 |
1.72 (1.46–2.03 ) |
1.58 (1.33–1.87) |
||
|
300 and more |
1.80 (1.55–2.09 ) |
1.61 (1.36–1.90) |
||
|
Osteoporosis, osteopenia |
||||
|
no |
1.00 (ref.) |
0.015a |
1.00 (ref.) |
n.s.a |
|
osteopenia |
1.15 (1.00–1.33) |
1.11 (0.95–1.27) |
||
|
osteoporosis |
1.21 (1.05–1.39) |
1.10 (0.93–1.29) |
Notes: a p for linear trend.
aPR – adjusted prevalence ratio; CI – confidence interval; cPR – crude prevalence ratio; n.s. – not significant; Ref – reference category.
In the unadjusted model, pneumonia sign prevalence was significantly higher in men (by 40%) than women, but after adjustment for other factors, gender differences became insignificant. Prevalence of COVID-19 signs on CT progressively increased with age (p for trend <0.001), but intergroup differences reached statistical significance only for age group ≥80 years, where COVID-19 signs were recorded 1.8 times more frequently than in reference group (<40 years). However, after including other variables in the multivariate model, all age differences in COVID-19 sign prevalence disappeared.
Rural residents had 13% higher prevalence of COVID-19 signs on CT in univariate analysis, but differences did not reach statistical significance (p = 0.058). The multivariate model showed no differences between urban and rural cancer patients in COVID-19 sign prevalence.
In the multivariate model, prevalence of COVID-19–associated pneumonia signs was 51–87% higher in lung cancer, head and neck tumors, and upper GIT tumors compared to female genital tumors. It was also significantly higher in breast cancer. For lower GIT tumors and prostate cancer, pneumonia sign prevalence did not differ significantly from the reference group.
Pulmonary emphysema signs were significantly associated with COVID-19 in both univariate and multivariate analyses. In patients with emphysema, after adjustment for all available factors, prevalence of COVID-19-associated pneumonia signs was 25% higher than in those without emphysema.
Radiological signs of aortic aneurysm or dilation were significantly associated with COVID-19 in univariate analysis, but no independent associations between this sign and pneumonia signs on CT were found. Another potential predictor of increased cardiovascular mortality – coronary artery calcification level measured by Agatston score – was associated with higher probability of COVID-19 pneumonia in both univariate and multivariate models. Adjusted PRs for pneumonia signs increased from 1.24 (95% CI 1.05–1.47) to 1.61 (95% CI 1.36–1.90) for scores 1–99 to ≥300 compared to the no–calcification reference group. Aortic aneurysm and pulmonary trunk dilation were associated with pneumonia signs on CT at significance level >0.15 in univariate modeling and were not included in the multivariate model.
Prevalence of COVID-19 signs progressively increased with osteoporosis severity (p = 0.015 for trend) in univariate analysis. After including other factors in the model, PRs decreased to statistically insignificant levels.
Our study found that half of MN patients admitted to AСOD in 2020-2021 for specialized treatment had signs of COVID-19-associated pneumonia, with most cases showing ≤25% lung involvement. We identified independent factors associated with COVID-19 pneumonia detection: cancer topography in lungs, head/neck, upper GIT, and breast, as well as presence of emphysema and coronary calcification on CT.
The COVID-19 pandemic significantly impacted cancer diagnosis and treatment organization: mortality reached 23.4% in hospitalized patients [13], mainly from pneumonia against 3-15-fold increased thrombosis rates [14]. Approximately 15–30% of hospitalized patients developed acute respiratory distress syndrome, increasing mortality risk [15]. Lung involvement volume on CT predicts COVID-19-associated pneumonia mortality [16]. COVID-19-associated pneumonia can be asymptomatic in 50% of patients [17][18], which is consistent with our findings.
Risk factors for severe disease include older age, male sex and comorbidities. In our study, age and male sex were not independent pneumonia risk factors. However, older patients and men in general population have higher risk of coronary vessel atherosclerosis and emphysema – factors that showed independent effects on pneumonia risk in our study. This highlights the need for comprehensive risk assessment.
Our analysis showed substantially higher pneumonia prevalence in lung, upper GIT, and head/neck cancer patients versus cohort average. Smoking is the most important modifiable risk factor for these MNs. While some early studies suggested protective association between smoking and COVID-19 severity (“smoker’s paradox” [19]), most authors link tobacco smoking with increased risk of symptomatic SARS-CoV-2 infection and disease progression [20][21]. A recent US analysis found current tobacco smoking significantly associated with increased hospitalization (Odds Ratio (OR) 1.72; 95% CI: 1.62–1.82; p < 0.001), ICU admission (OR 1.22; 95% CI: 1.10–1.34; p < 0.001) and all-cause mortality (OR 1.37; 95% CI: 1.20–1.57; p < 0.001) after adjustment [22]. Our assumption about smoking and CT opacity probability is further supported by more frequent pneumonia signs in men, who smoke more.
Among healthcare AI services, radiology has the most products. Russia’s largest AI radiology project is the Experiment on Using Innovative Computer Vision Technologies for Medical Image Analysis in Moscow Healthcare System, which processed >12 million radiological studies. In this project, IRA Labs LLC leads the maturity matrix for comprehensive chest CT AI by performance quality (ROC AUC) [7]. Using this algorithm detects pneumonia signs more frequently than unaided interpretation.
Study strengths include population-based design, using all available CTs for analysis. PBCR data completeness was previously validated at high levels. For example, the mortality/incidence ratio in Arkhangelsk Region and NAO PBCR for 2008–2017 is 0.58, comparable to Eastern European registries. Death certificate only (DCO) rate is 4.5%, higher than in European countries, but this can be explained by high autopsy rates (>60% in MN patients) and, subsequently, a high rate of accident postmortem cancers. The difference between cases registered in PBCR during 2008–2017 and annual reports versus 5-year updated data is <3% [10].
Reliable PBCR patient data enabled assessment of lung infection prevalence in a representative MN patient cohort and provided high statistical power. Another key advantage is using objective AI-derived radiological criteria, revealing higher viral pneumonia probability with chronic lung (emphysema) and coronary vessel diseases.
Chest CT was used both for routine MN staging/diagnosis and COVID-19 symptom evaluation. Separating these streams was impossible in this design. However, hospitalization rules during pandemic required baseline disease exclusion, making hospital-acquired infection risk random and dependent only on analyzed factors.
Correlation of CT pneumonia signs with SARS-CoV-2 PCR results was impossible. However, during the pandemic, other viral infections rarely caused pneumonia [23]. Moreover, many cases with clear clinical manifestations had initial negative nasopharyngeal PCR, with COVID-19 later confirmed by repeat PCR or seroconversion [24].
Incomplete INIPA data in PBCR. However, we assume most patients undergoing chest CT during 04/2020–12/2021 were in follow-up category by 2021. Among 1542 patients with validated CTs and AI analysis, 74.4% matched PBCR records.
The cancer registry doesn’t collect smoking data, preventing independent assessment of this factor’s impact on CT pneumonia sign risk.
Clinical significance of incidentally detected CT pneumonia signs in MN patients will be assessed in survival and cause-of-death analyses. Since age was an independent mortality risk factor in some COVID-19 pneumonia studies [25][26], we plan to analyze the overall cohort survival by age.
In this analysis, half of the patients admitted to Arkhangelsk oncology center during COVID-19 pandemic showed CT signs of pneumonia. Independent factors associated with COVID-19 pneumonia detection include tumor location (lung, head/neck, upper GIT, breast) and CT signs of emphysema and coronary calcification.
Andrey A. Dyachenko – development of the research concept, development of the methodology, analysis of the work, drafting the manuscript, critical revision of the text, interpretation of the research results, final approval of the manuscript. Andrej M. Grjibovski – development of the methodology, statistical analysis and its interpretation, critical revision of the text, interpretation of the research results. Maxim A. Bogdanov, Dmitriy V. Bogdanov, Valeria Yu. Chernina – analysis of the work, critical revision of the text, interpretation of the research results. Ekaterina A. Nazarova – analysis of the work, critical revision of the text, interpretation of the research results. Anna A. Meldo, Mikhail G. Belyaev – critical revision of the text, interpretation of the research results. Victor A. Gombolevsky, Mikhail Yu. Valkov – scientific supervision, development of the research concept, development of the methodology, critical revision of the text, interpretation of the research results. All authors approved the final version of the article.
Ethics statements. The study was conducted in accordance with the permission of the Local Bioethics Committee of the Northern State Medical University, No 07/10-238, 2023.
Data availability. The data that support the findings of this study are available from the corresponding authors on reasonable request. Data and statistical methods used in the article were examined by a professional biostatistician on the Sechenov Medical Journal editorial staff.
Conflict of interests. Valeria Yu. Chernina – Head of the Clinical Evaluation Department of the LLC “IRA Labs”, Mikhail Yu. Belyaev – General Director of the LLC “IRA Labs”, Viktor A. Gombolevsky – Advisor of the LLC “IRA Labs”.
Financing. The study was conducted using funds and resources from LLC “IRA Labs”.
Acknowledgments. The authors express their gratitude to the staff of the radiation diagnostics department of the “AСOD” for their intensive work on data collection during the COVID-19 pandemic. The authors also thank the staff of the population cancer registry of the Arkhangelsk Region and the Nenets Autonomous Okrug for collecting, analyzing and interpreting data on patients with malignant neoplasms from two regions of the Russian Federation for more than two decades, which is truly unique for the country.
1. Website of the Federal Service for Surveillance in Healthcare (Roszdravnadzor). State Register of Medical Devices and Organizations (Individual. Entrepreneurs), Engaged in the Production and Manufacturing of Medical Devices https://roszdravnadzor.gov.ru/services/misearch (access date: 10.12.2024).
1. Dinmohamed A.G., Visser O., Verhoeven R.H.A., et al. Fewer cancer diagnoses during the COVID-19 epidemic in the Netherlands. Lancet Oncol. 2020 Jun; 21(6): 750–751. doi: 10.1016/S1470-2045(20)30265-5. Epub 2020 Apr 30. Erratum in: Lancet Oncol. 2020 Jun; 21(6): e304. https://doi.org/10.1016/S1470-2045(20)30267-9. PMID: 32359403
2. Barclay N.L., Pineda Moncusí M., Jödicke A.M., et al. The impact of the UK COVID-19 lockdown on the screening, diagnostics and incidence of breast, colorectal, lung and prostate cancer in the UK: a population-based cohort study. Front Oncol. 2024 Mar 27; 14: 1370862. https://doi.org/10.3389/fonc.2024.1370862. PMID: 38601756
3. Malignant neoplasms in Russia in 2020 (incidence and mortality). Edited by A.D. Kaprin, V.V. Starinsky, A.O. Shakhzadova, M., 2021, 252 p. (In Russian). ISBN 978-5-85502-268-1
4. Lohfeld L., Sharma M., Bennett D., et al. Impact of the COVID-19 pandemic on breast cancer patient pathways and outcomes in the United Kingdom and the Republic of Ireland – a scoping review. Br J Cancer. 2024 Sep; 131(4): 619–626. https://doi.org/10.1038/s41416-024-02703-w. Epub 2024 May 4. Erratum in: Br J Cancer. 2024 Sep; 131(4): 778. https://doi.org/10.1038/s41416-024-02791-8. PMID: 38704477
5. Valkova L.E., Dyachenko A.A., Merabishvili V.M., et al. Impact of the СOVID-19 pandemic on cancer incidence in patients undergoing cancer screening during annual health checkup (populationbased study). Siberian journal of oncology. 2022; 21(6): 7–16 (In Russian). https://doi.org/10.21294/1814-4861-2022-21-6-7-16. EDN: COFCHN
6. Kotlyarov P.M., Sergeev N.I., Solodkiy V.A., Soldatov D.G. The multispiral computed tomography in the early diagnosis of pneumonia caused by SARS-CoV-2. Pulmonologiya. 2020; 30(5): 561–568 (In Russian). https://doi.org/10.18093/0869-0189-2020-30-5-561-568. EDN: RJGOCV
7. Chernina V.Y., Belyaev M.G., Silin A.Y., et l. Analysis of the diagnostic and economic impact of the combined artificial intelligence algorithm for analysis of 10 pathological findings on chest computed tomography. Digital Diagnostics. 2023; 4(2); 105–132 (In Russian). https://doi.org/10.17816/DD321963. EDN: UGUJWJ
8. Allemani C., Matsuda T., Di Carlo V., et al. Global surveillance of trends in cancer survival 2000–14 (CONCORD-3): analysis of individual records for 37 513 025 patients diagnosed with one of 18 cancers from 322 population-based registries in 71 countries. Lancet. 2018 Mar 17; 391(10125): 1023–1075. https://doi.org/10.1016/S0140-6736(17)33326-3. Epub 2018 Jan 31. PMID: 2939526
9. Allemani C., Weir H.K., Carreira H., et al. Global surveillance of cancer survival 1995-2009: analysis of individual data for 25,676,887 patients from 279 population-based registries in 67 countries (CONCORD-2). Lancet. 2015 Mar 14; 385(9972): 977–1010. https://doi.org/10.1016/S0140-6736(14)62038-9. Epub 2014 Nov 26. Erratum in: Lancet. 2015 Mar 14; 385(9972): 946. PMID: 25467588
10. Barchuk A., Tursun-Zade R., Nazarova E., et al. Completeness of regional cancer registry data in Northwest Russia 2008-2017. BMC Cancer. 2023 Oct 18; 23(1): 994. https://doi.org/10.1186/s12885-023-11492-z. PMID: 37853404
11. Valkov M.Yu., Grzhibovsky A.M., Kudryavtsev A.V., et al. Utilizing artificial intelligence to predict and prevent non-oncological mortality in cancer patients: the ARILUS study protocol. Ekologiya cheloveka (Human Ecology). 2024; 31(4): 314–330 (In Russian). https://doi.org/10.17816/humeco635357. EDN: DDFTVK
12. Morozov S.P., Gombolevskiy V.A., Cherninа V.Yu., et al. Prediction of lethal outcomes in COVID-19 cases based on the results chest computed tomography. Tuberculosis and Lung Diseases. 2020; 98(6): 7–14 (In Russian). https://doi.org/10.21292/2075-1230-2020-98-6-7-14. EDN: IBBYVG
13. Jazieh A.R., Bounedjar A., Abdel-Razeq H., et al. Impact of COVID-19 on Management and Outcomes of Oncology Patients: Results of MENA COVID-19 and Cancer Registry (MCCR). J Immunother Precis Oncol. 2024 May 2; 7(2): 82–88. https://doi.org/10.36401/JIPO-23-38. PMID: 38721403
14. Keene S., Abbasizanjani H., Torabi F., et al. Risks of major arterial and venous thrombotic diseases after hospitalisation for influenza, pneumonia, and COVID-19: A population-wide cohort in 2.6 million people in Wales. Thromb Res. 2025 Jan; 245: 109213. https://doi.org/10.1016/j.thromres.2024.109213. Epub 2024 Nov 19. PMID: 39608301
15. Attaway A.H., Scheraga R.G., Bhimraj A., et al. Severe covid-19 pneumonia: pathogenesis and clinical management. BMJ. 2021 Mar 10; 372: n436. https://doi.org/10.1136/bmj.n436. PMID: 33692022
16. Fan L., Wu S., Wu Y., et al. Clinical data and quantitative CT parameters combined with machine learning to predict short-term prognosis of severe COVID-19 in the elderly. Heliyon. 2024 Sep 7; 10(18): e37096. https://doi.org/10.1016/j.heliyon.2024.e37096. PMID: 39309817
17. Hu Z., Song C., Xu C., et al. Clinical characteristics of 24 asymptomatic infections with COVID-19 screened among close contacts in Nanjing, China. Sci China Life Sci. 2020 May; 63(5): 706–711. https://doi.org/10.1007/s11427-020-1661-4. Epub 2020 Mar 4. PMID: 32146694
18. Wang Y., Liu Y., Liu L., et al. Clinical outcomes in 55 patients with Severe Acute Respiratory Syndrome Coronavirus 2 who were asymptomatic at hospital admission in Shenzhen, China. J Infect Dis. 2020 May 11; 221(11): 1770–1774. https://doi.org/10.1093/infdis/jiaa119. PMID: 32179910
19. Leung J.M., Yang C.X., Tam A., et al. ACE-2 expression in the small airway epithelia of smokers and COPD patients: implications for COVID-19. Eur Respir J. 2020 May 14; 55(5): 2000688. https://doi.org/10.1183/13993003.00688-2020. PMID: 32269089
20. Simons D., Shahab L., Brown J., Perski O. The association of smoking status with SARS-CoV-2 infection, hospitalization and mortality from COVID-19: a living rapid evidence review with Bayesian meta-analyses (version 7). Addiction. 2021 Jun; 116(6): 1319–1368. https://doi.org/10.1111/add.15276. Epub 2020 Nov 17. PMID: 33007104
21. Oliveira F.E.S., Oliveira M.C.L, Martelli Júnior H. et al. The impact of smoking on COVID-19-related mortality: a Brazilian national cohort study. Addict Behav. 2024 Sep; 156: 108070. https://doi.org/10.1016/j.addbeh.2024.108070. Epub 2024 May 25. PMID: 38796931
22. Griffith N.B., Baker T.B., Heiden B.T., et al. Cannabis, tobacco use, and COVID-19 outcomes. JAMA Netw Open. 2024 Jun 3; 7(6): e2417977. doi: 10.1001/jamanetworkopen.2024.17977. Erratum in: JAMA Netw Open. 2024 Jul 1; 7(7): e2427937. https://doi.org/10.1001/jamanetworkopen.2024.27937. PMID: 38904961
23. Boeva E.V., Belyakov N.A., Simakina O.E., et al. Epidemiology and course of infectious diseases during the COVID-19 pandemic. Report 2. Interference engaged between SARS-COV-2 and acute respiratory viral infections. Russian Journal of Infection and Immunity. 2022; 12(6): 1029–1039 (In Russian). https://doi.org/10.15789/2220-7619-EAC-1960. EDN: ZMXIGW
24. Martinez-Fierro M.L., González-Fuentes C., Cid-Guerrero D., et al. Radiological findings increased the successful of COVID-19 diagnosis in hospitalized patients suspected of respiratory viral infection but with a negative first SARS-COV-2 RT-PCR result. Diagnostics (Basel). 2022 Mar 11; 12(3): 687. https://doi.org/10.3390/diagnostics12030687. PMID: 35328241
25. Sahutoğlu E., Kabak M., Çil B., et al. Radiologic severity index can be used to predict mortality risk in patients with COVID-19. Tuberk Toraks. 2024 Dec; 72(4): 280–287. English. https://doi.org/10.5578/tt.202404994. PMID: 39745227
26. Schalekamp S., Bleeker-Rovers C.P., Beenen L.F.M., et al. Chest CT in the emergency department for diagnosis of COVID-19 pneumonia: Dutch experience. Radiology. 2021 Feb; 298(2): E98–E106. https://doi.org/10.1148/radiol.2020203465. Epub 2020 Nov 17. PMID: 33201791
Andrey A. Dyachenko, Cand. of Sci. (Medicine), Associate Professor, Department of Radiology, Radiation Therapy and
Oncology
51, Troitskiy Ave., Arkhangelsk, 163000
Andrej M. Grjibovski, Dr. of Sci. (Medicine), Head of the Directorate for Scientific and Innovation Work; Professor, Department of Healthcare Organization and Preventive Medicine; Adviser to the Rector
51, Troitskiy Ave., Arkhangelsk, 163000
58, Belinsky str., Yakutsk, 677000
8/2А, Kalinina str., Saint Petersburg, 198095
Maxim A. Bogdanov, Assistant Professor, Department of
Radiation Diagnostics
51, Troitskiy Ave., Arkhangelsk, 163000
Dmitrii V. Bogdanov, Assistant Professor, Department of Public Health, Healthcare and Social Work; Chief Physician
51, Troitskiy Ave., Arkhangelsk, 163000
145, bld. 1, Obvodny Ave., Arkhangelsk, 163045
Ekaterina A. Nazarova, physician-methodologist
68, Leningradskaya str., St. Petersburg, 197758
Anna A. Meldo, Dr. of Sci. (Medicine), Professor, Department of Radiology, Radiation Therapy and Oncology
51, Troitskiy Ave., Arkhangelsk, 163000
Valeria Yu. Chernina, Assistant Professor, Department of Radiation Diagnostics, Radiation Therapy and Oncology; Head of the Department of Clinical Evaluation of AI
30, bld. 1, Bolshoy Boulevard, Moscow, 121205
Mikhail G. Belyaev, Cand. of Sci. (Physics and Mathematics),
Professor, General Director
30, bld. 1, Bolshoy Boulevard, Moscow, 121205
Victor A. Gombolevskiy, Cand. of Sci. (Medicine), Advisor,
Radiologist; Leading Researcher; Senior Researcher
30, bld. 1, Bolshoy Boulevard, Moscow, 121205
32, bld. 1, Kutuzovsky Ave., Moscow, 121170
8/2, Trubetskaya str., Moscow, 119048
Mikhail Yu. Valkov, Dr. of Sci. (Medicine), Professor, Head
of the Department of Radiology, Radiation Therapy and
Oncology
51, Troitskiy Ave., Arkhangelsk, 163000
145, bld. 1, Obvodny Ave., Arkhangelsk, 163045
|
|
1. Графический абстракт | |
| Subject | ||
| Type | Исследовательские инструменты | |
View
(198KB)
|
Indexing metadata ▾ | |
|
|
2. Graphic abstract | |
| Subject | ||
| Type | Исследовательские инструменты | |
View
(193KB)
|
Indexing metadata ▾ | |

|
3. STROBE checklist | |
| Subject | ||
| Type | Исследовательские инструменты | |
Download
(736KB)
|
Indexing metadata ▾ | |
Sechenov Medical Journal. Editor's checklist for this article you can find here.
Журнал «Сеченовский вестник» |
| Sechenov Medical Journal |
Рецензии на рукопись |
| Peer-review reports |
Название / Title | Распространенность признаков пневмонии, ассоциированной с инфекцией COVID-19, на компьютерных томограммах органов грудной клетки у онкологических больных: исследование АРИЛИС / Prevalence of COVID-19-associated pneumonia signs on chest computed tomography in cancer patients: the ARILUS study
|
Раздел / Section
| ВНУТРЕННИЕ БОЛЕЗНИ / INTERNAL MEDICINE |
Тип / Article | Оригинальная статья / Original article
|
Номер / Number | 1191
|
Страна/территория / Country/Territory of origin | Россия / Russia |
Язык / Language | Русский / Russian
|
Источник / Manuscript source | Инициативная рукопись / Unsolicited manuscript |
Дата поступления / Received | 27.02.2025 |
Тип рецензирования / Type ofpeer-review | Двойное слепое / Double blind |
Язык рецензирования / Peer-review language | Русский / Russian
|
РЕЦЕНЗЕНТ А / REVIEWER A
Инициалы / Initials | 1191_А |
Научная степень / Scientific degree | Кандидат технических наук / Candidate of Technical Sciences |
Страна/территория / Country/Territory | Россия / Russia |
Дата рецензирования / Date of peer-review | 18.03.2025 |
Число раундов рецензирования / Number of peer-review rounds | 1 |
Финальное решение / Final decision | принять к публикации / accept |
ПЕРВЫЙ РАУНД РЕЦЕНЗИРОВАНИЯ / FIRST ROUND OF PEER-REVIEW
Представленная для рецензирования работа описывает результаты научно-практического эксперимента, направленного на применение модели машинного обучения на данных реальной клинической практики, накопленных в системе здравоохранения Архангельской области.
Тема работы является актуальной и перспективной с точки зрения публикации, присутствует научная новизна и практическая значимость представленных результатов. В настоящее время имеется выраженный недостаток работ, проведенных на реальных данных субъектов РФ с оценкой метрик качества работы моделей ИИ и их эффективности.
Исследование соответствует правилам этики проведения исследований и публикации их результатов – дизайн исследования одобрен локальным этическим комитетом.
Цели, материалы и методы, результаты и обсуждение соответствуют друг другу. Заключение выглядит обоснованным, соответствующим представленным результатам. Научная терминология соответствует принятой в рассматриваемой области знаний, находится на достаточном уровне, замечаний не выявлено. Валидность и новизна выбранных литературных источников заслуживает доверие. Текст написан компактным и хорошим научным языком.
РЕЦЕНЗЕНТ B / REVIEWER B
Инициалы / Initials | 1191_В |
Научная степень / Scientific degree | Доктор медицинских наук / Dr. of Sci. (Medicine) |
Страна/территория / Country/Territory | Россия / Russia |
Дата рецензирования / Date of peer-review | 23.03.2025 |
Число раундов рецензирования / Number of peer-review rounds | 1 |
Финальное решение / Final decision | Принять к публикации после небольшой доработки/ Minor revision |
ПЕРВЫЙ РАУНД РЕЦЕНЗИРОВАНИЯ / FIRST ROUND OF PEER-REVIEW
Актуальность статьи обусловлена использованием искусственного интеллекта (ИИ) в клинической практике. Название отражает суть статьи. Введение: достаточно отражает суть проблемы. Методика соответствует требованиям журнала и отрасли знаний, не требует изменения. Статистика соответствует требованиям международных стандартов. Результаты изложены четко и не требуют изменений. Обсуждение результатов достаточно и соответствует основным полученным результатам. Литература достаточна для статьи и не требует переработки.
Краткие замечания, сделанные рецензентом:
РЕЦЕНЗЕНТ C / REVIEWER C
Инициалы / Initials | 1191_C |
Научная степень / Scientific degree | Доктор технических наук / Doctor of Technical Sciences |
Страна/территория / Country/Territory | Россия / Russia |
Дата рецензирования / Date of peer-review | 30.03.2025 |
Число раундов рецензирования / Number of peer-review rounds | 1 |
Финальное решение / Final decision | Принять к публикации после небольшой доработки/ Minor revision |
ПЕРВЫЙ РАУНД РЕЦЕНЗИРОВАНИЯ / FIRST ROUND OF PEER-REVIEW
Статья соответствует тематике журнала и актуальна. В статье описан пример применения современных технологий искусственного интеллекта (ИИ), предназначенных для обработки медицинских диагностических изображений, и базы данных территориально-популяционного регистра для проведения эпидемиологического исследования. Статья написана хорошим профессиональным литературным языком и может быть рекомендована к публикации.
Вместе с тем имеется ряд замечаний и рекомендаций редакционного характера:
РЕКОМЕНДАЦИИ НАУЧНЫХ РЕДАКТОРОВ ЖУРНАЛА / RECOMMENDATIONS
OF THE SCIENTIFIC EDITORS OF THE JOURNAL
Просьба унифицированно указывать везде по тексту две выделенные Вами подгруппы: с и без признаков пневмонии.
Текст требует согласования: «Программы скрининга рака молочной железы, шейки матки и др. опухолей были приостановлены в период пандемии, а затем поэтапно возобновлены с учетом рисков с более длительным временем, чтобы обеспечить сокращение численности персонала и усиление режимов инфекционного контроля»
«Более того, исследования, в которых бессимптомные лица с подтвержденным тяжелым острым респираторным синдромом, вызванным SARS-CoV-2 (Severe acute respiratory syndrome-related coronavirus 2 (коронавирус тяжелого острого респираторного синдрома — 2) проходили визуализацию органов грудной клетки, выявили изменения у 50% пациентов”
Для улучшения понимания текста просьба разбить на два предложения: «Популяционные регистры рака, с их большими размерами выборки и охватом населения, имеют хорошие возможности для мониторинга изменений распределения стадии при первичной диагностике и расчета выживаемости в период пандемии COVID-19, несмотря на трудности с определением точной стадии во время диагностики, поскольку хирургическое вмешательство и патологоанатомическая оценка задерживаются.»
Необходимо удалить повтор текста в обсуждении из введения. «В этом проекте ООО «АЙРА Лабс» возглавляет матрицу зрелости среди комплексных ИИ для КТ для органов грудной клетки по качеству работы (ROC AUC), оцененной … Значение этих минимальных изменений на КТ предстоит выяснить.»
Целесообразно уточнить смысл: «Достоверные данные о пациентах в ПРР позволили оценить распространенность инфекционного поражения легких в когорте, представляющей всю популяцию пациентов с ЗНО и обеспечить высокую статистическую мощность.» В Вашем исследовании есть критерии включения и исключения. Обо всей популяции речь вряд ли может идти.
Женщин в когорте 634 (55,2%) – далее в тексте - 2/3, просьба скорректировать описание.
Возраст по тексту представлен в виде интервалов и непрерывной переменной. Просьба уточнить это и указать как представлены значения: медиана? Среднее? Использовался ли тест на нормальность?
В таблицах проверить суммы по столбцам (99,9–100,1%)
Просьба к каждой таблице дать в примечаниях расшифровку всех перечисленных в ней аббревиатур
Просьба уточнить что обозначено разными цветами на рисунке.
Для унификации описания просьба: либо дать все синонимы одномерная / нескорректированная модель в разделе Материалы и методы либо использовать только введенные термины: одномерная, многомерная модель.
Необходимо согласовать описание текста и рисунок. Если исключены случаи ателектаза легкого, необходимо это обозначить на рисунке и уточнить количество таких случаев и описать на основании какого алгоритма они исключались.
Исключены серии КТ с внутривенным контрастированием: уточните сколько случаев и основании какого алгоритма?
Кейсы с артефактами: уточните число кейсов и что принималось за артефакты.
Неполная зона сканирования: уточните число пациентов и что принималось за неполную зону.
Зачем выгружались данные ПРР, если вторым этапом после КТ ОГК было подтверждение диагноза ЗНО? В текущей версии схемы диагноз ЗНО подтверждался дважды и не совпал по ПРР и данным АКОД у 394 человек. Из схемы получается, что у 25% пациентов наблюдающихся в АКОД нет ЗНО. Просьба объяснить такое расхождение.
8-2 Trubetskaya st., Moscow, 119048
Federal State Autonomous Educational Institution of Нigher Education I.M.Sechenov First Moscow State Medical University of the Ministry of Health of the Russian Federation (Sechenovskiy University)
E-mail: sechenovmedj@staff.sechenov.ru
Processing of personal data


