


Contents
Scroll to:
 T. V. Khorobrykh,
E. V. Poddubskaya,
V. G. Agadzhanov,
L. M. Tulina,
I. V. Ivashov,
A. V. Grachalov,
M. A. Tsai,
Ia. A. Drach,
Z. A. Omarova
T. V. Khorobrykh,
E. V. Poddubskaya,
V. G. Agadzhanov,
L. M. Tulina,
I. V. Ivashov,
A. V. Grachalov,
M. A. Tsai,
Ia. A. Drach,
Z. A. Omarova https://doi.org/10.47093/2218-7332.2025.16.2.39-51
Scroll to:
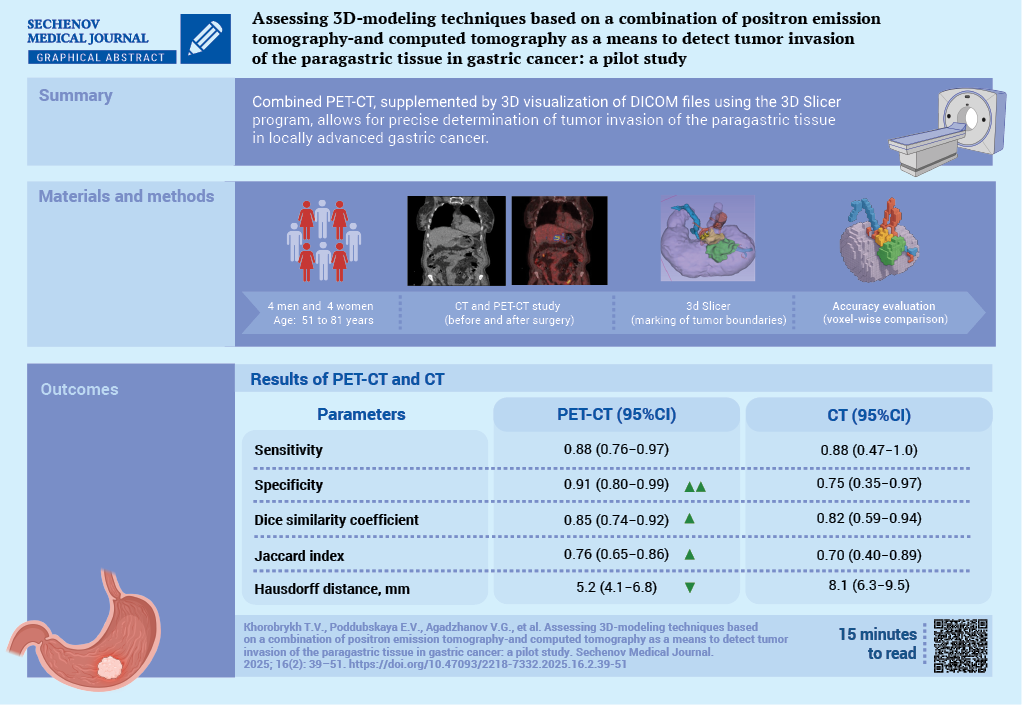
Aim. To evaluate the diagnostic capabilities of combined positron emission tomography (PET) with accumulation of 18-fluorodeoxyglucose and computed tomography (CT) data, with additional 3D-visualization of CT DICOM files using the 3D Slicer software, in detecting tumor invasion of the paragastric tissue in locally advanced gastric cancer.
Materials and methods. A prospective open-label study was conducted as part of the research project “SmartGastro”. Four women and four men aged 51 to 81 years with a histologically confirmed diagnosis of gastric cancer underwent combined PET/CT following the “Whole Body” protocol at 60–80 minutes after the administration of the radiopharmaceutical agent (RPA). The obtained results were analyzed through visual assessment of CT and PET images separately, as well as through fused scans, followed by 3D reconstruction based on CT DICOM data. All patients underwent surgery. The resected macroscopic specimen was stepwise excised along its perimeter, followed by a histological examination of the resection margins (paragastric fat tissue). In all cases, R0 resection was confirmed, indicating radical tumor removal. The initial delineation of tumor boundaries based on PET-CT and CT imaging was compared voxel-by-voxel with the secondary delineation performed through a visual assessment of the excised macroscopic specimen.
Results. In 5 out of 8 cases, compromised peritumoral paracardial tissue detected on CT corresponded to regions of radiopharmaceutical agent uptake on PET. Areas demonstrating increased RPA accumulation in the peritumoral tissue, along with a corresponding rise in densitometric values on CT, were indicative of true invasion. This was confirmed by a histological examination of the resected specimen, in 6 out of 8 cases. The sensitivity of combined PET/CT, assessed on a voxel-by-voxel basis against postoperative pathological findings, was 0.88 (95% confidence interval (CI): 0.76–0.97), while specificity reached 0.91 (95% CI: 0.80–0.99). The discrepancy in tumor boundaries between these modalities, determined using the Hausdorff distance, was 5.2 mm, with a mean tumor size of 38×30×39 mm. Conclusion. Combined PET/CT enables the surgeon to identify precisely a compromised mesolayer adipose tissue.
The construction of 3D-models of perigastric tissues affected by the tumor process, combined with the visualization of the gastric tumor and associated vasculature, facilitates comprehensive preoperative planning for oncological surgery.
Gastric cancer is the fourth leading cause of cancer-related mortality and the fifth most common malignancy worldwide. The prognosis depends on the disease stage. At the time of diagnosis, more than half of patients already have locally advanced disease or distant metastases [1].
The diagnosis of gastric cancer is based on a combination of instrumental methods, including esophagogastroduodenoscopy with biopsy, contrast-enhanced computed tomography (CT), endoscopic ultrasound, and diagnostic laparoscopy with cytological examination of peritoneal washings [2][3]. In recent years, the combined positron emission tomography (PET) and CT method has emerged and is being considered. This technique allows for a simultaneous assessment of both morphological and functional changes. This method can be used both for preoperative evaluation of gastric tumor spread and for assessing how to treat the disease. Combined PET-CT is performed in preoperative diagnostics in cases where staging with standard imaging methods is inconclusive [4–7].
Contrast-enhanced CT remains the gold standard for diagnosing and staging gastric cancer and is included in the list of mandatory preoperative examinations [8]. According to the relevant literature, CT sensitivity in determining primary tumor size for locally advanced processes ranges from 68% to 85%, while for regional lymph node involvement it ranges from 72% to 87%. Signs of adipose tissue involvement are typically limited to visual analysis and its description as perinodal changes, edema, densification, and fibrotic strands [9]. When analyzing CT images of locally advanced gastric cancer, an increased density of the paragastric fat is observed which visually manifests as coarse/fine fibrotic stranding and altered lymph nodes. The densitometric measurements of these fat areas often approach tumor density, making it difficult to differentiate between gastric wall boundaries and surrounding tissues [10]. Segmentation and reconstruction of these areas, along with correlation of radiopharmaceutical agent uptake levels on PET and actual morphological findings, may make it easier to visualise lymphatic drainage pathways and create a personalized tumor model for preoperative planning.
With the active implementation of embryologically guided surgery in oncology, understanding embryonic layer boundaries enables organ resection within its ‘embryonic’ fascial layers, which serve as natural barriers against tumor spread. The concept of ‘mesogastrectomy’ encompasses resection not only of individual lymph nodes but also the paragastric fat along with its lymphatic and blood vessels [11–13].
Aim: to evaluate the diagnostic capabilities of combining PET with accumulation of 18-fluorodeoxyglucose and CT data, with additional 3D-visualization of CT DICOM files using the 3D Slicer software as a means of detecting tumor invasion of the paragastric tissue in locally advanced gastric cancer.
An open prospective study was conducted as part of the research project «SmartGastro». A continuous enrollment of patients hospitalized with newly diagnosed gastric cancer was carried out at the G.I. Lukomsky Clinic of Faculty Surgery No. 2 (Sechenov University), from March 1, 2021, to October 30, 2024.
Figure 1 presents a flow diagram illustrating patient enrollment in the study. Consecutive patient sampling was performed. A total of 37 patients were screened to see if they were feasible candidates for participating in the study, of whom 18 underwent PET-CT imaging. Exclusion criteria were found in 10 patients. Ultimately, 8 patients were enrolled in the study.
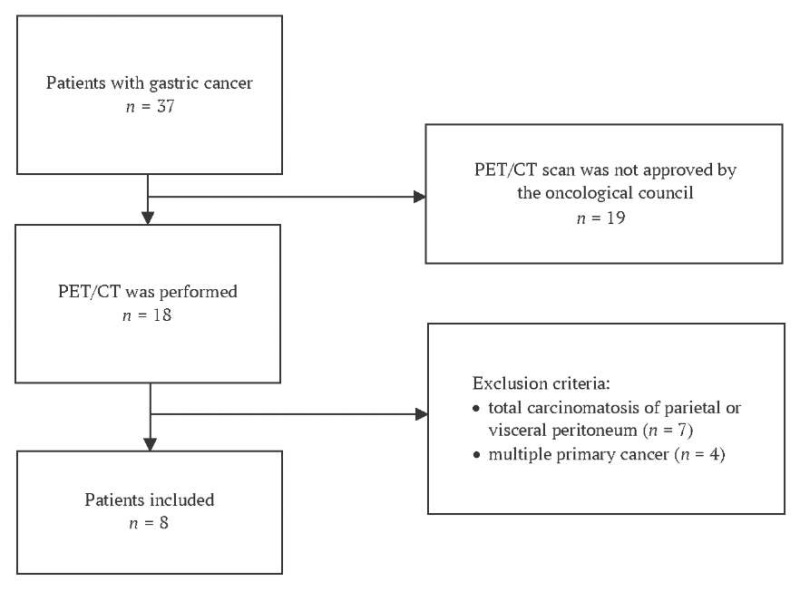
FIG. 1. Flow chart showing patient inclusion in the study
Note: PET-CT – positron emission tomography – computed tomography scan.
Inclusion Criteria:
Exclusion Criteria:
All the patients that were enrolled underwent surgical treatment for gastric cancer followed by a histopathological examination of surgical specimens. Six patients received neoadjuvant chemotherapy prior to surgery.
A histopathological evaluation was performed by certified pathologists from the Department of Pathology at Sechenov University in accordance with the College of American Pathologists guidelines1, and the WHO Classification of Tumors of the Digestive System2. Surgical specimens were placed in 10% neutral buffered formalin for 24 hours. Macroscopic evaluation included: tumor growth pattern (Lauren classification), anatomical localization, tumor dimensions, and distance to resection margins.
The specimens were processed by isolating the lymph nodes according to the JGCA3 classification. The specimens were then sectioned with parallel cuts followed by standard paraffin embedding. Then, the serial and stepwise histological sections were stained with hematoxylin and eosin. A microscopic evaluation included an assessment of tumor invasion depth, presence of tumor cells near resection margins, lymph node metastases (including greater and lesser omentum), as well as the total number of removed and metastatic lymph nodes. Surgical radicality was categorized as follows: R0 – no tumor cells at resection margins, R1 – microscopic tumor cells at resection line, R2 – macroscopic tumor cells at resection line, Rx – inability to assess margins due to tumor fragmentation.
Integrated PET-CT imaging was performed at the PET-Technology Center of Sechenov University after the patient had fasted for 6 hours. Patients received an intravenous injection of ¹⁸F-fluorodeoxyglucose at a dose of 195-410 MBq (weight-adjusted), followed by a 60-80 minute uptake period. A standard whole-body acquisition was performed from the orbital level to the mid-thigh, combined with low-dose CT for PET attenuation correction.
Image reconstruction was performed automatically with subsequent co-registration of PET and CT images. PET data interpretation was conducted using both visual and semi-quantitative methods. A visual analysis of PET scans was carried out employing grayscale and color scales in three projections, with generation of three-dimensional maximum intensity projection images for each plane. All the PET findings were systematically correlated with the corresponding CT images that were acquired during the same examination session.
For semi-quantitative analysis of PET images, the standardized uptake value (SUVmax) was calculated. Areas of increased radiopharmaceutical uptake (hypermetabolism) that did not correspond to physiological distribution patterns were considered pathological. The analysis included a visual assessment of both CT and PET images separately, as well as an evaluation of fused PET/CT images. Peritumoral adipose tissue was comparatively analyzed using both densitometric measurements (on CT) and radiopharmaceutical uptake patterns (on PET).
Additionally, a team of specialists – oncologists, surgeons, and radiologists (L.M.T. – radiology diagnostician, 5 years of experience; M.A.Ts. – radiology diagnostician, 3 years of experience) – performed tumor process reconstruction using the «3D Slicer image computing platform». This platform is distributed under an open-source license by «The Open Source Initiative» and has no restrictions on lawful use [15].
Lymphovascular, perineural or venous invasion of the fibre, as well as the presence of free tumor deposits in it, was referred to as ‘paragastric tumor invasion’. The process of marking the compromised peri-tumoral fibre was as follows: in the presence of one or several visual signs of the fibre lesion, such as heaviness, increased accumulation of contrast agent, presence of altered lymph nodes in the fibre, the areas with its average densitometric density measurement were marked. For comparison, a number of areas with densities of retroperitoneal, peritoneal fibre, large omentum were marked. The arithmetic mean value of normal fibre was calculated and compared with the values of the affected fibre.
To assess the accuracy of preoperative localization of pathological foci identified using combined PET-CT or CT, a voxel-wise comparison was performed with the reference standard marked on CT. The initial segmentation of PET-CT and CT images was carried out by a radiologist using the 3D Slicer software, employing volumetric segmentation based on densitometric contrast analysis. The postoperative (reference) tumor boundaries were secondarily marked on CT by another radiologist in 3D Slicer, based on visual analysis of the resected gross specimen, which was sequentially excised along the perimeter, followed by histological examination of the resection margins. In all cases, the radicality of the intervention (R0) was confirmed. Microscopic images of the resected gastric specimens were measured in a fully unfolded state to standardize volumetric assessments. The secondary CT segmentation was used as the ground truth for calculating accuracy metrics because this modality makes it easier to visualize the compromised mesolayer margins.
The approximate tumor volume was calculated based on the largest axial diameters measured on CT scans in three orthogonal planes: frontal (mean value: 38 ± 2 mm), sagittal (mean value: 30 ± 3 mm), and vertical (mean value: 39 ± 3 mm). These dimensions were used to estimate the histological reference tumor volume, which enabled interpretation of the metrics reflecting the segmentation accuracy of fused PET-CT images and CT scans.
To quantitatively assess the spatial correspondence between tumor boundaries identified by PET-CT and CT with histological mapping, the Dice similarity coefficient (Dice Similarity Coefficient) and Jaccard index (Intersection over Union) were calculated. The Hausdorff distance was computed to determine the maximum discrepancy between tumor boundaries delineated by PET-CT/CT and the histological reference standard.
The diagnostic accuracy of primary tumor boundary delineation (using PET-CT or CT) was compared against the reference standard CT segmentation (based on gross specimen analysis and histologically confirmed) using sensitivity and specificity metrics. True positives were defined as voxels correctly identified as tumorous by both primary and reference segmentations; false positives as voxels labeled tumorous by primary segmentation but not confirmed by the reference standard; false negatives as voxels classified as non-tumorous by primary segmentation but identified as tumorous in the reference standard; and true negatives as voxels correctly classified as non-tumorous by both segmentations. Given the small sample size (n = 8), 95% confidence intervals (CIs) for sensitivity and specificity were calculated using the Wilson score method.
Results were reported as median values with ranges (minimum–maximum). The analysis was performed using Python (version 3.13) with MONAI and SciPy libraries. A p-value < 0.05 was considered statistically significant.
The study cohort comprised 4 women and 4 men aged 51-81 years. According to the ASA (American Society of Anesthesiologists) classification [16], 6 of 8 patients were categorized as ASA class II. The most prevalent comorbidities were ischemic heart disease and type 2 diabetes mellitus. Tumor localization included the antrum (n = 3), cardia/body (n = 4), and subtotal involvement (n = 1). Local complications (bleeding or stenosis) were present in 50% of patients (Table 1).
Table 1. Clinical characteristics of patients
|
Feature |
Patients with gastric cancer (n = 8) |
|
Men, n (%) |
4 (50) |
|
Age, years |
54 (51–81) |
|
Body mass index, kg/m² |
23.8 (20.2–24.7) |
|
Physical status according to ASA, n (%) |
|
|
ASA I |
2 (25) |
|
ASA II |
6 (75) |
|
ECOG scale status, n (%) |
|
|
0 |
2 (25) |
|
1 |
4 (50) |
|
2 |
2 (25) |
|
Comorbidity, n (%) |
|
|
coronary heart disease |
3 (37.5) |
|
arterial hypertension |
1 (12.5) |
|
atrial fibrillation |
1 (12.5) |
|
type II diabetes mellitus |
2 (25) |
|
chronic obstructive pulmonary disease |
2 (2) |
|
Localization of the tumor, n (%) |
|
|
cardia |
2 (25) |
|
body |
2 (25) |
|
antrum |
3 (37.5) |
|
subtotal lesion |
1 (12.5) |
|
Complication of the tumor process, n (%) |
|
|
bleeding |
1 (12.5) |
|
proximal stenosis |
1 (12.5) |
|
distal stenosis |
2 (25) |
Note: ASA – American Society of Anesthesiologists physical status classification system; ECOG – Eastern Cooperative Oncology Group performance status scale.
Table 2 summarizes the characteristics of the tumors and how they were treated. The histopathological tumor type was consistent between preoperative biopsy and postoperative histological examination of surgical specimens in all patients.
Table 2. Characteristics of stomach cancer before and after treatment
|
№ |
Region |
cTNM, type, grade |
Treatment |
pTNM |
Invasion |
MG, HU |
PET/CT equals 3D-CT |
||
|
LV |
PN |
PF |
|||||||
|
1 |
EJ |
cT3N2M0, adenocarcinoma, G1 |
Proximal gastrectomy, distal esophageal resection D2 |
pT4aN2M0 |
+ |
+ |
+ |
32.8 |
+ |
|
2 |
EJ |
cT4aN1M1, squamous cell carcinoma |
NACT, total gastrectomy, distal esophageal resection D2 |
pT4aN1M1 |
+ |
- |
+ |
26.4 |
+ |
|
3 |
GB |
cT3N1M0, аdenocarcinoma, G2 |
NACT, total gastrectomy D2 |
pT3N2M0 |
+ |
- |
+ |
44.5 |
+ |
|
4 |
GB |
cT3N1M0, adenocarcinoma, G3 |
NACT, total gastrectomy D2 |
pT3N0M0 |
- |
- |
- |
56.3 |
- |
|
5 |
GA |
cT3N2M0, adenocarcinoma, G1; and signet-ring cells |
NACT, distal gastrectomy D2 |
pT3N1M0 |
+ |
- |
+ |
54.3 |
- |
|
6 |
GA |
cT4bN1M0, аdenocarcinoma, G2 |
NACT, distal gastrectomy D2 |
pT4bN1M0 |
+ |
+ |
+ |
30.7 |
+ |
|
7 |
GA |
cT3N1M0, аdenocarcinoma, G1 |
NACT, distal gastrectomy D2 |
pT3N2M1 |
- |
+ |
- |
43.1 |
- |
|
8 |
SGI |
cT4aN2M1, signet ring cell carcinoma |
NACT, total gastrectomy D2 |
pT3N2M1 |
+ |
- |
+ |
29.1 |
+ |
Note: CT – computed tomography; cTNM – clinical stage; EJ – esophagogastric junction (Siewert II); GA – gastric antrum; GB – gastric body; HU – Hounsfield unit; LV – lymphovascular; MG – mesogastrium; NACT – neoadjuvant chemotherapy; PET – positron emission tomography; PF – perigastric fat (dissociated tumor cells); PN – perineural; pTNM – pathological stage; SGI – subtotal gastric involvement.
The mean maximum standardized uptake value (SUVmax) in hypermetabolic regions was 17.8 ± 1.3 for antral tumors, 19.4 for gastric body tumors, and 14.7 for tumors at the esophagogastric junction. These quantitative measurements facilitated a precise delineation of pathological tissue boundaries.
Poorly differentiated tumors demonstrated higher radiopharmaceutical uptake, consistent with their increased proliferative activity. However, two cases – signet ring cell carcinoma (Patient No. 8) and adenocarcinoma with signet ring cell features (Patient No. 5) – showed low uptake levels. These were probably attributable to the specific biochemical characteristics of the tumors.
When comparing visually altered regional lymph nodes on CT with areas of increased radiotracer uptake (hyperfixation) on PET-CT, a correlation between CT and PET findings was observed in 5 out of 8 cases. Tumor invasion into adjacent organs – specifically the pancreas (1 patient) – was detected on fused PET-CT imaging. These images showed an increased radiotracer metabolism and reduced densitometric values in the pancreas and spleen (down to 20 HU) in areas adjacent to the tumor.
According to the TNM classification, the characteristic CT findings in the T3-stage (5 patients) included irregular contours of the outer organ wall and infiltration of the paragastric fat. In T4-stage tumors (3 patients), tumor extension beyond the gastric wall was accompanied by infiltration of the adipose tissue. In these cases, the organ contour on CT and PET became indistinct and frayed, while the paraesophageal fat was thickened and surrounded the esophagus in a stellate “rim” pattern with reduced densitometric values (20–70 HU).
When the tumor invaded the gastric wall, changes in the paragastric fat were detected on both th CT and the PET. If the tumor extended into the ligaments, varying degrees of thickening were observed in the peritoneal layers of the ligaments and the adipose tissue between them. In 5 out of 8 cases, compromised (densitometrically dense) peritumoral paracardial fat on CT correlated with areas of radiotracer uptake on PET.
Areas of increased radiotracer uptake in the peritumoral fat on PET, combined with elevated densitometric values in the same regions on CT, correlated with confirmed tumor invasion on histological examination of the resected specimen in 6 out of 8 cases.
Voxel-based comparison revealed that primary tumor delineation using fused PET-CT demonstrated higher diagnostic accuracy than CT-based delineation alone (Table 3). The primary PET-CT segmentation showed no statistically significant difference from secondary CT-based segmentation with 3D visualization (p = 0.41). Primary CT-based segmentation alone was significantly less accurate than secondary CT segmentation with 3D visualization (p = 0.033).
Table 3. Comparison of the diagnostic accuracy of primary tumor boundary delineation (on PET/CT or CT) with the reference segmentation on CT (constructed based on the macroscopic specimen and histologically confirmed)
|
PET/CT |
CT |
|
|
Sensitivity |
0.88 (95% CI 0.76−0.97) |
0.88 (95% CI 0.47−1.00) |
|
Specificity |
0.91 (95% CI 0.80−0.99) |
0.75 (95% CI 0.35−0.97) |
|
Dice similarity coefficient |
0.85 (95% CI 0.74−0.92) |
0.82 (95% CI 0.59−0.94) |
|
Jaccard index |
0.76 (95% CI 0.65−0.86) |
0.70 (95% CI 0.40−0.89) |
|
Hausdorff distance, mm |
5.2 (95% CI 4.1−6.8) |
8.1 (95% CI 6.3−9.5) |
Note: CI – confidence interval; CT – computed tomography; PET – positron emission tomography.
Visual expert analysis revealed poorly defined or indistinguishable tumor margins on non-contrast CT images (Figs. 2A, 3A, 4A). While fused PET-CT successfully visualized the tumor, it provided limited differentiation between the tumor and paragastric adipose tissue (Fig. 4). Three-dimensional reconstruction utilizing CT DICOM data and tissue densitometry achieved satisfactory visualization of both the tumor mass and surrounding paragastric fat compartments (Fig. 4).
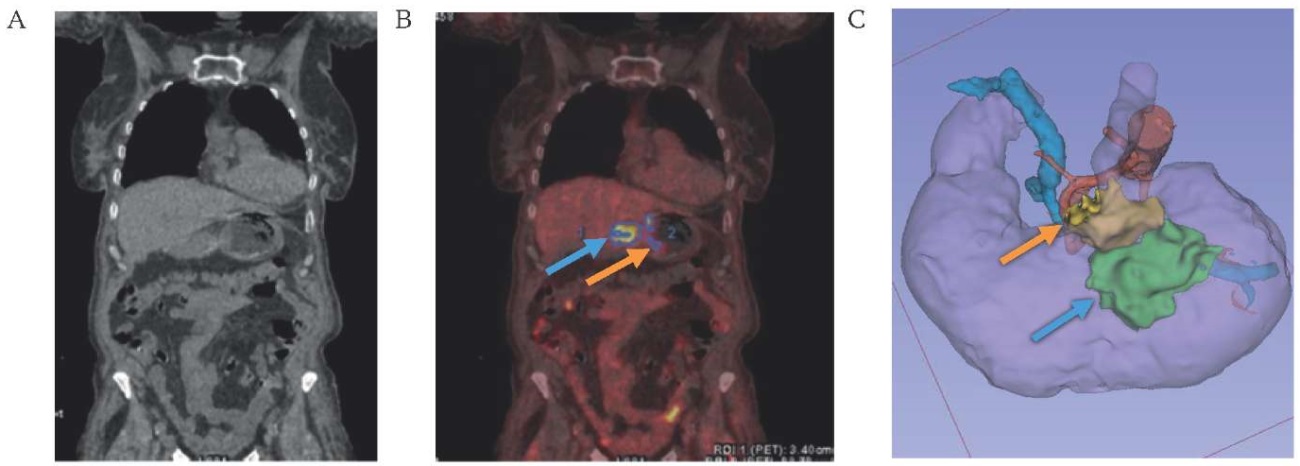
FIG. 2. Visualization of cancer of the middle third of the stomach body.
A. Native computed tomography.
B. Combined positron emission tomography-computed tomography.
C. 3D-model of the mesogastrium based on computes tomography DICOM data.
Note: the level of accumulation of radiopharmaceutical 18-fluorodeoxyglucose in the tumor (blue arrow) and paragastric tissue (orange arrow).
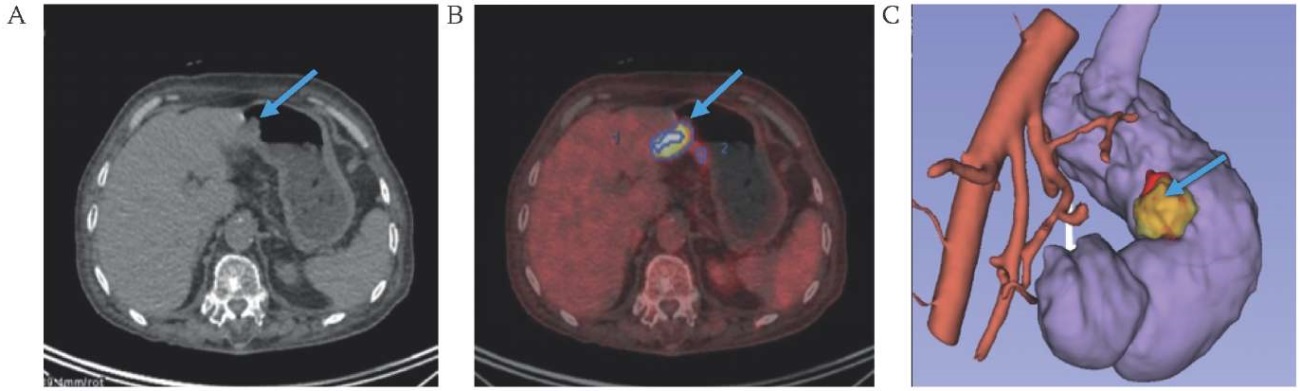
FIG. 3. Visualization of cancer of the antrum of the stomach (arrow).
A. Native computed tomography.
B. Combined positron emission tomography-computed tomography.
C. 3D-model of the mesogastrium based on computes tomography DICOM data.
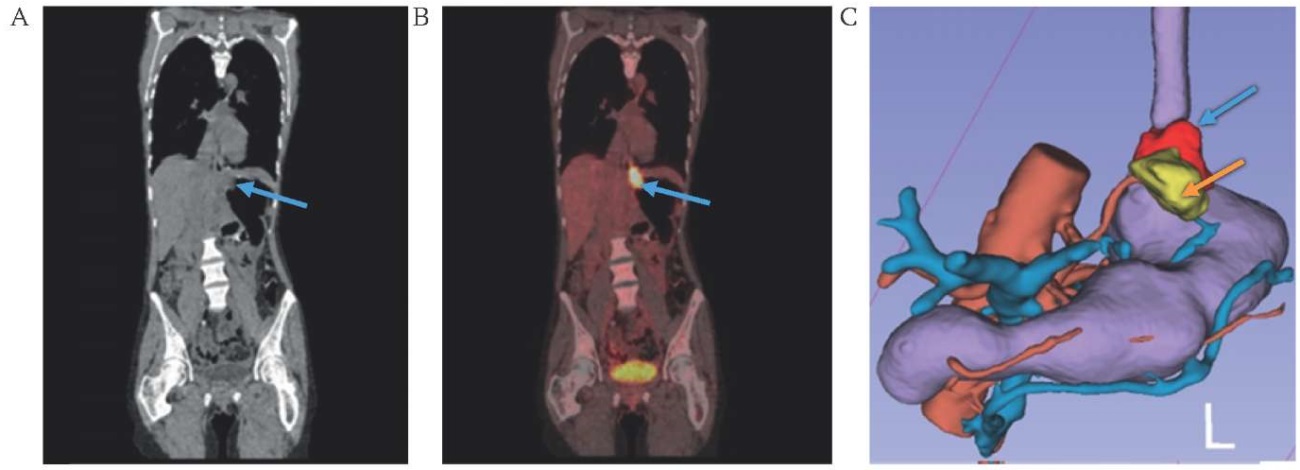
FIG. 4. Visualization of cancer of the cardioesophageal junction.
A. Native computed tomography.
B. Combined positron emission tomography-computed tomography.
C. 3D-model of the mesogastrium based on computes tomography DICOM data.
Note: the level of accumulation of radiopharmaceutical 18-fluorodeoxyglucose in the tumor (blue arrow) and paragastric tissue (orange arrow).
Tumor boundary delineation based on fused PET-CT is highly accurate (sensitivity – 0.88, specificity – 0.91) when compared to tumor boundaries in histological examination of postoperative specimens. A quantitative assessment of boundary agreement between PET-CT segmentation and histological microslides revealed high similarity coefficients (Dice coefficient 0.85, Jaccard index 0.76), while the maximum tumor boundary discrepancy between the two modalities, calculated using the Hausdorff distance, averaged 5.2 mm. Given the mean tumor size of 38×30×39 mm, this value can be considered satisfactory. When delineating tumor boundaries based solely on CT, accuracy metrics were slightly lower. However, despite comparable results, the wider confidence intervals observed in CT-based segmentation of the compromised mesolayer suggest greater variability and ‘randomness’ in boundary definition in areas with subtle tumor invasion, such as the paragastric layer. Thus, CT provides less consistent tumor delineation compared to PET-CT.
The peritumoral adipose tissue−a component of the «embryonic mesogastrium»−is often compromised and appears denser on CT scans in locally advanced tumors. Tumor invasion of this tissue (venous, lymphovascular, and perineural) is considered a negative prognostic factor [17–23]. In the present study, for 5 out of 8 patients, CT-detected densitometric consolidation of the peritumoral fat corresponded to radiotracer-avid areas on PET, which, combined with postoperative histopathological findings, revealed an association between its density and true tumor invasion.
The study additionally analyzed the density of peritumoral adipose tissue, reconstructed these areas in 3D Slicer software based on CT images from fused PET-CT scans, and compared the resulting 3D models with the ‘reference’ PET-CT segmentation. Tumor process modeling using CT DICOM files has been used for several years in urology, thoracic surgery, and pancreatology. For instance, Russian researchers have developed a neural network for generating 3D kidney tumor models [24]. In such modeling, angioarchitecture plays a central role—vessel reconstruction serves as a key guide for lymph node dissection [25–28]. Preoperative 3D modeling techniques involve constructing the tumor model itself and defining its spatial relationship to adjacent vessels [9][19]. With the adoption of laparoscopic surgery which is performed under limited visual control and without tactile feedback, the need has arisen for unified anatomical landmarks, anatomical navigation, and standardization of technical approaches [29][30].
Korean and Japanese surgeons have successfully developed programs for reconstructing the stomach, celiac trunk vessels, and spatial relationships between the stomach and surrounding organs based on CT data. A notable example is the recent development by Korea’s National Institute under the leadership of Professor Hyung W.J. – the RUS™ program. This software simulates intraoperative conditions with pneumoperitoneum modeling using CT DICOM files, allowing surgeons to evaluate individual gastric anatomy, vascular structures, and adjacent organs [25]. The pneumoperitoneum simulation enables highly accurate modeling of intraoperative conditions and surgical steps. During validation of this software in gastric cancer patients, the authors confirmed the accuracy of 3D reconstruction. However, the program’s developers did not address peritumoral adipose tissue in their model.
An alternative algorithm for 3D reconstruction of the stomach and surrounding tissues for preoperative planning was developed by Jin Woong Kim et al. [31]. However, this method relies on contrast-enhanced CT and virtual esophagogastroduodenoscopy (EGD) data. Consequently, it demonstrates reduced diagnostic value and reconstruction accuracy for tumors and affected surrounding tissues in early-stage cancer compared to fused PET-CT, as CT imaging offers a sharply limited color spectrum. In the early stages (superficial parietal lesions), conventional EGD typically reveals only mucosal discoloration as an indicator of malignancy without significant fold alterations. Therefore, when abnormal tumor-associated mucosal thickening is not detected on 2D images, this method’s 3D reconstruction cannot identify the tumor or generate a detailed three-dimensional model. Furthermore, it should be noted that gastric secretions, food residue, and mechanical suture/clip lines may mimic gastric cancer and be mistaken for true malignant lesions.
Advantages of 3D tumor modeling using 3D Slicer software include the method’s minimal invasiveness and cost-effectiveness. This is thanks to its reconstruction which is based on contrast-enhanced CT data – a routine, mandatory examination included in clinical guidelines. Furthermore, 3D reconstruction enables an accurate restoration of peritumoral adipose tissue architecture along with adjacent veins, lymphatic vessels, and nerve fibers. This enhances the radicality of surgical intervention and improves 5-year patient survival rates. The proposed method will allow oncologists and surgeons to preoperatively determine tumor margins and perform resection within healthy tissue boundaries which should improve prognosis and survival outcomes in gastric cancer patients.
The study has several limitations, including a small patient cohort, insufficient follow-up duration for comprehensive assessment of prognosis and survival outcomes, and the limited sensitivity of CT in detecting adipose tissue infiltration. Future research should focus on advancing preoperative 3D modeling of the mesogastric layer to improve detection of tumor-affected areas with elevated densitometric values. Expanding the study population would enable the creation of annotated DICOM datasets for training more sophisticated predictive models to enhance clinical decision-making in gastric cancer management.
The study demonstrated how accurate the integrated PET-CT approach can be in assessing tumor invasion of the mesofat layer in gastric cancer patients, with a sensitivity of 0.88 (95% CI: 0.76-0.97) and specificity of 0.91 (95% CI: 0.80-0.99). PET-CT showed superior precision in detecting tumor infiltration compared to CT alone. On CT images, tumor margins within the compromised mesofat layer were poorly differentiated due to similar tissue densities and lack of pronounced contrast enhancement, complicating accurate preoperative invasion assessment. Three-dimensional modeling of these regions based on CT DICOM data, combined with PET-CT visualization of gastric tumors and vasculature, enabled precise tumor boundary delineation and facilitated comprehensive preoperative planning for oncological surgeries.
Tatiana V. Khorobrykh, Vadim G. Agadzhanov, Ivan V. Ivashov performed the surgical procedures, collected diagnostic data, marked up DICOM files, analyzed the results, and developed the concept and design of the study. Larisa M. Tulina performed positron emission tomography with 18-fluorodeoxyglucose and computed tomography with intravenous contrast. Anton V. Grachalov, Maria A. Tsai, Zumrud A. Omarova marked up DICOM files, created and analyzed the 3D models, collected data for research and prepared the manuscript. Elena V. Poddubskaya corrected and critically revisited the manuscript. Iaroslav A. Drach performed the statistical analysis, developed methods for collecting and analyzing data, prepared the text of the manuscript as well as constructed and analyzed the 3D models. All the authors approved the final version of the article.
Ethics statements. The study was approved by the Local Ethics Committee of Federal State Autonomous Educational Institution of Sechenov First Moscow State Medical University (Sechenov University), No. 09-24 from 04.04.2024. All patients signed an informed consent to participate in the study.
Data availability. The data confirming the findings of this study are available from the authors upon request. Data and statistical methods used in the article were examined by a professional biostatistician who sits on the Sechenov Medical Journal editorial staff.
Conflict of interests. The authors declare that there is no conflict of interest.
Funding. The study was self-funded.
Acknowledgments. The authors would like to express their gratitude to Alexey P. Muravlev, a specialist in radiation diagnostics (Sechenov First Moscow State Medical University (Sechenov University)), and Olga S. Kondrashina (Kulakov Research Center for Obstetrics, Gynecology and Perinatology) for their assistance in consulting and interpreting the diagnostic data obtained.
1. College of American Pathologists. Stomach Cancer Resection Protocol. Version 4.1.0.0. https://documents.cap.org/protocols/cp-giupper-stomach-20-4100.pdf (access date: 23.08.2024).
2. WHO Classification of Tumours Editorial Board. Digestive System Tumours. 5th ed. Lyon: IARC; 2019. https://publications.iarc.fr/Book-And-Report-Series/Who-Classification-Of-Tumours/Digestive-System-Tumours-2019 (access date: 23.08.2024).
3. Japanese Gastric Cancer Association. Japanese Classification of Gastric Carcinoma. 2nd English ed. Tokyo: Kanehara; 1998. https://www.jgca.jp/wp-content/uploads/2023/08/JCGC-2E.pdf (access date: 23.08.2024).
1. Yang W.J., Zhao H.P., Yu Y., et al. Updates on global epidemiology, risk and prognostic factors of gastric cancer. World J Gastroenterol. 2023 Apr 28;29(16):2452–2468. https://doi.org/10.3748/wjg.v29.i16.2452. PMID: 37179585
2. Withey S.J., Goh V., Foley K.G. State-of-the-art imaging in oesophago- gastric cancer. Br J Radiol. 2022 Sep 1;95(1137):20220410. https://doi.org/10.1259/bjr.20220410. Epub 2022 Jun 15. PMID: 35671095
3. Chen Q.Y., Zhong Q., Liu Z.Y., et al. Indocyanine green fluorescence imaging-guided versus conventional laparoscopic lymphadenectomy for gastric cancer: long-term outcomes of a phase 3 randomised clinical trial. Nat Commun. 2023 Nov 16;14(1):7413. https://doi.org/10.1038/s41467-023-42712-6. PMID: 37973806
4. Ruan D., Zhao L., Cai J., et al. Evaluation of FAPI PET imaging in gastric cancer: a systematic review and metaanalysis. Theranostics. 2023 Aug 21;13(13):4694–4710. https://doi.org/10.7150/thno.88335. PMID: 37649615
5. Lordick F., Carneiro F., Cascinu S., et al. Electronic address: clinicalguidelines@esmo.org. Gastric cancer: ESMO Clinical Practice Guideline for diagnosis, treatment and follow-up. Ann Oncol. 2022 Oct;33(10):1005–1020. https://doi.org/10.1016/j.annonc.2022.07.004. Epub 2022 Jul 29. PMID: 35914639
6. López Sala P., Leturia Etxeberria M., Inchausti Iguíñiz E., et al. Gastric adenocarcinoma: A review of the TNM classification system and ways of spreading. Radiologia (Engl Ed). 2023 Jan- Feb;65(1):66–80. https://doi.org/10.1016/j.rxeng.2022.10.011. PMID: 36842787
7. Ma D., Zhang Y., Shao X., Wu C., Wu J. PET/CT for predicting occult lymph node metastasis in gastric cancer. Curr Oncol. 2022 Sep 11;29(9):6523–6539. https://doi.org/10.3390/curroncol29090513. PMID: 36135082
8. Sun J., Wang Z., Zhu H., Yang Q., Sun Y. Advanced gastric cancer: CT radiomics prediction of lymph modes metastasis after neoadjuvant chemotherapy. J Imaging Inform Med. 2024 Dec;37(6):2910–2919. https://doi.org/10.1007/s10278-024-01148-0. Epub 2024 Jun 17. PMID: 38886288
9. Awiwi M.O., Ramanan R.V., Elshikh M., Vikram R. Imaging of gastric carcinoma. Part one: diagnosis and staging. J Gastrointest Abdom Radiol. 2021;4(03):194–205. https://doi.org/10.1055/s-0041-1735217. ISSN 2581-9933
10. Shinohara H., Kurahashi Y., Haruta S., Ishida Y., Sasako M. Universalization of the operative strategy by systematic mesogastric excision for stomach cancer with that for total mesorectal excision and complete mesocolic excision colorectal counterparts. Ann Gastroenterol Surg. 2017 Oct 23;2(1):28–36. https://doi.org/10.1002/ags3.12048. PMID: 29863126
11. Shinohara H. Illustrated abdominal surgery: based on embryology and anatomy of the digestive system. 2020. https://doi.org/10.1007/978-981-15-1796-9. ISBN: 978-981-15-1795-2
12. Nakamura T., Yamada S., Funatomi T., et al. Three-dimensional morphogenesis of the omental bursa from four recesses in staged human embryos. J Anat. 2020 Jul;237(1):166–175. https://doi.org/10.1111/joa.13174. Epub 2020 Feb 16. PMID: 32064626
13. Ma T., Li X., Zhang T., et al. Effect of visceral adipose tissue on the accuracy of preoperative T-staging of gastric cancer. Eur J Radiol. 2022 Oct;155:110488. https://doi.org/10.1016/j.ejrad.2022.110488. Epub 2022 Aug 17. PMID: 35988392
14. Sok M., Zavrl M., Greif B., Srpčič M. Objective assessment of WHO/ECOG performance status. Support Care Cancer. 2019 Oct;27(10):3793–3798. https://doi.org/10.1007/s00520-018-4597-z. Epub 2019 Feb 5. PMID: 30721369
15. Fedorov A., Beichel R., Kalpathy-Cramer J., et al. 3D Slicer as an image computing platform for the Quantitative Imaging Network. Magn Reson Imaging. 2012 Nov;30(9):1323–1341. https://doi.org/10.1016/j.mri.2012.05.001. Epub 2012 Jul 6. PMID: 22770690
16. Mak P.H.K., Campbell R.C.H., Irwin M.G. American Society of Anesthesiologists. The ASA Physical Status Classification: interobserver consistency. American Society of Anesthesiologists. Anaesth Intensive Care. 2002 Oct;30(5):633–640. https://doi.org/10.1177/0310057X0203000516. PMID: 12413266
17. Kulig P., Pach R., Majewska O., Kulig J. Clinicopathological prognostic factors determining outcomes of treatment in gastric cancer surgery. In Vivo. 2022 Nov-Dec;36(6):2927–2935. https://doi.org/10.21873/invivo.13035. PMID: 36309397
18. Kinami S., Nakamura N., Miyashita T., et al. Life prognosis of sentinel node navigation surgery for early-stage gastric cancer: Outcome of lymphatic basin dissection. World J Gastroenterol. 2021 Dec 14;27(46):8010–8030. https://doi.org/10.3748/wjg.v27.i46.8010. PMID: 35046627
19. Ebihara Y., Kyogoku N., Murakami Y., et al. Relationship between laparoscopic total gastrectomy-associated postoperative complications and gastric cancer prognosis. Updates Surg. 2023 Jan;75(1):149–158. https://doi.org/10.1007/s13304-022-01402-6. Epub 2022 Nov 11. PMID: 36369627
20. Liu H., Wang F., Liu B., et al. Application of three-dimensional reconstruction with a Hisense computer-assisted system in upper pancreatic lymph node dissection during laparoscopic-assisted radical gastrectomy. Asian J Surg. 2021 May;44(5):730–737. https://doi.org/10.1016/j.asjsur.2020.12.034. Epub 2021 Jan 23. PMID: 33500172
21. Guo D., Zhu X.Y., Han S., Liu Y.S., Cui D.P. Evaluating the use of three-dimensional reconstruction visualization technology for precise laparoscopic resection in gastroesophageal junction cancer. World J Gastrointest Surg. 2024 May 27;16(5):1311–1319. https://doi.org/10.4240/wjgs.v16.i5.1311. PMID: 38817296
22. Iino I., Kikuchi H., Suzuki T., et al. Comprehensive evaluation of three-dimensional anatomy of perigastric vessels using enhanced multidetector-row computed tomography. BMC Surg. 2022 Nov 21;22(1):403. https://doi.org/10.1186/s12893-022-01836-0. PMID: 36404317
23. Zhang L., Zheng F., Peng Z., Hu Z., Yang Z. A feasible method of angiogenesis assessment in gastric cancer using 3D microvessel density. Stem Cells Int. 2018 Apr 3;2018:7813729. https://doi.org/10.1155/2018/7813729. PMID: 29765420
24. Chernenkiy I.M., Chernenkiy M.M., Fiev D.N., Sirota E.S. Segmentation of renal structures based on contrast computed tomography scans using a convolutional neural network. Sechenov Medical Journal. 2023;14(1):39–49. https://doi.org/10.47093/2218-7332.2023.14.139-49. EDN OKTADT
25. Park S.H., Kim K.Y., Kim Y.M., Hyung W.J. Patient-specific virtual three-dimensional surgical navigation for gastric cancer surgery: A prospective study for preoperative planning and intraoperative guidance. Front Oncol. 2023 Feb 21;13: 1140175. https://doi.org/10.3389/fonc.2023.1140175. PMID: 36895483
26. Lopez P., Belgacem A., Sarnacki S., et al. Enhancing surgical planning for abdominal tumors in children through advanced 3D visualization techniques: a systematic review of future prospects. Front Pediatr. 2024 May 7;12:1386280. https://doi.org/10.3389/fped.2024.1386280. PMID: 38863523
27. Cheng J., Wang Z., Liu J., et al. Value of 3D printing technology combined with indocyanine green fluorescent navigation in complex laparoscopic hepatectomy. PLoS One. 2022 Aug 11;17(8):e0272815. https://doi.org/10.1371/journal.pone.0272815. PMID: 35951521
28. Husarova T., MacCuaig W.M., Dennahy I.S., et al. Intraoperative imaging in hepatopancreatobiliary surgery. Cancers (Basel). 2023 Jul 20;15(14):3694. https://doi.org/10.3390/cancers15143694. PMID: 37509355
29. Han Z., Dou Q. A review on organ deformation modeling approaches for reliable surgical navigation using augmented reality. Comput Assist Surg (Abingdon). 2024 Dec;29(1):2357164. https://doi.org/10.1080/24699322.2024.2357164. Epub 2024 Sep 10. PMID: 39253945
30. Wang Y., Cao D., Chen S.L., et al. Current trends in three-dimensional visualization and real-time navigation as well as robot-assisted technologies in hepatobiliary surgery. World J Gastrointest Surg. 2021 Sep 27;13(9):904–922. https://doi.org/10.4240/wjgs.v13.i9.904. PMID: 34621469
31. Kim J.W., Shin S.S., Heo S.H., et al. The role of three-dimensional multidetector CT gastrography in the preoperative imaging of stomach cancer: emphasis on detection and localization of the tumor. Korean J Radiol. 2015 Jan-Feb;16(1):80–89. https://doi.org/10.3348/kjr.2015.16.1.80. Epub 2015 Jan 9. PMID: 25598676
Tatiana V. Khorobrykh, Dr. of Sci. (Medicine), Professor of the Russian Academy of Sciences, Head of the G.I. Lukomsky Faculty Surgery Clinic No. 2
8/2, Trubetskaya str., Moscow, 119048, Russia
Elena V. Poddubskaya, Cand. of Sci. (Medicine), Senior Researcher, Institute of Personalized Oncology
8/2, Trubetskaya str., Moscow, 119048, Russia
Vadim G. Agadzhanov, Cand. of Sci. (Medicine), Associate Professor of the Department of Faculty Surgery No. 2 named after G.I. Lukomsky
8/2, Trubetskaya str., Moscow, 119048, Russia
Larisa M. Tulina, Cand. of Sci. (Medicine), Associate Professor, Department of Pharmacology; Chief Physician
8/2, Trubetskaya str., Moscow, 119048, Russia
2/8, Bolshaya Pirogovskaya str., Moscow, 119435
Ivan V. Ivashov, Cand. of Sci. (Medicine), Associate Professor of the Department of Faculty Surgery No. 2 named after G.I. Lukomsky
8/2, Trubetskaya str., Moscow, 119048, Russia
Anton V. Grachalov, postgraduate student, Department of
Faculty Surgery No. 2 named after G.I. Lukomsky
8/2, Trubetskaya str., Moscow, 119048, Russia
Maria A. Tsai, radiologist
2/8, Bolshaya Pirogovskaya str., Moscow, 119435
Iaroslav A. Drach, student
5/1, 2nd Baumanskaya str., Moscow, 105005
Zumrud A. Omarova, student, N.V. Sklifosovsky Institute of Clinical Medicine
8/2, Trubetskaya str., Moscow, 119048, Russia
|
|
1. Графический абстракт | |
| Subject | ||
| Type | Исследовательские инструменты | |
View
(194KB)
|
Indexing metadata ▾ | |
|
|
2. Graphic abstract | |
| Subject | ||
| Type | Исследовательские инструменты | |
View
(196KB)
|
Indexing metadata ▾ | |

|
3. Standards for Reporting Diagnostic accuracy studies | |
| Subject | ||
| Type | Исследовательские инструменты | |
Download
(765KB)
|
Indexing metadata ▾ | |
Журнал "Сеченовский вестник". Лист редактора можно посмотреть здесь.
Sechenov Medical Journal. Editor's checklist you can find here.
Рецензии на рукопись |
| Peer-review reports |
Название / Title | 3D-моделирование на основании совмещенной позитронно-эмиссионной икомпьютерной томографии в выявлении опухолевой инвазиипарагастральной клетчатки при раке желудка: пилотное исследование / Assessing 3D-modeling techniques based on a combination of positron emission tomography-and computed tomography as a means to detect tumor invasion of the paragastric tissue in gastric cancer: a pilot study
|
Раздел / Section
| ОНКОЛОГИЯ/ONCOLOGY
|
Тип / Article | Оригинальная статья / Original article
|
Номер / Number | 1139
|
Страна/территория / Country/Territory of origin | Россия / Russia |
Язык / Language | Русский / Russian
|
Источник / Manuscript source | Инициативная рукопись / Unsolicited manuscript |
Дата поступления / Received | 14.12.2024 |
Тип рецензирования / Type ofpeer-review | Двойное слепое / Double blind |
Язык рецензирования / Peer-review language | Русский / Russian
|
РЕЦЕНЗЕНТ А / REVIEWER A
Инициалы / Initials | 1139_А |
Научная степень / Scientific degree | Доктор медицинских наук / Dr. of Sci. (Medicine) |
Страна/территория / Country/Territory | Россия / Russia |
Дата рецензирования / Date of peer-review | 24.01.2025 |
Число раундов рецензирования / Number of peer-review rounds | 1 |
Финальное решение / Final decision | принять к публикации / accept |
ПЕРВЫЙ РАУНД РЕЦЕНЗИРОВАНИЯ / FIRST ROUND OF PEER-REVIEW
Злокачественные новообразования занимают ведущее положение в структуре заболеваемости и смертности населения мира. Рак желудка входит в пятерку наиболее распространенных раков в России по заболеваемости и в тройку по смертности от злокачественных новообразований. Актуальность темы исследования несомненна, так как в статье представлены пути улучшения диагностики рака желудка с помощью современных методов лучевой диагностики.
Значимость работы и научная новизна представленного исследования связаны разработкой и внедрением в гастроонкологию совмещенной позитронно-эмиссионной томографии (ПЭТ) и компьютерной томографии (КТ) при 3D-визуализации компрометированного «мезогастрия» с использованием 18 фтордезоксиглюкозы в качестве радиофармпрепарата на дооперационном этапе при местнораспространенном раке желудка. В исследовании проанализированы также плотность мезогастральной клетчатки, реконструированные в программе 3D-Slicer и оценена её корреляция с данными ПЭТ/КТ.
В статье четко определены методологические принципы применения современных технологий лучевой диагностики (ПЭТ/КТ в 3D-визуализации), позволившие достоверно оценить состояние мезогастрия при местнораспространенном раке желудка.
Результаты предварительных результатов исследования пациентов согласовываются с целью работы, выводы соответствующие. В статье в достаточном объеме отражено и обосновано состояние проблемы. Название темы полностью раскрыто и соответствует содержанию статьи. Литературные источники актуальные, в основном использованы публикации последних 5–7 лет по представленной теме статьи. Материал статьи изложен целостно, логически и последовательно в традиционном формате с использованием общепринятых научных терминов.
РЕЦЕНЗЕНТ B / REVIEWER B
Инициалы / Initials | 1139_В |
Научная степень / Scientific degree | Кандидат медицинских наук / Cand. of Sci. (Medicine) |
Страна/территория / Country/Territory | Германия / Germany |
Дата рецензирования / Date of peer-review | 02.02.2025 |
Число раундов рецензирования / Number of peer-review rounds | 1 |
Финальное решение / Final decision | принять к публикации /accept
|
ПЕРВЫЙ РАУНД РЕЦЕНЗИРОВАНИЯ / FIRST ROUND OF PEER-REVIEW
Цель исследования — анализ данных совмещенной ПЭТ/КТ при 3D-визуализации компрометированного мезогастрия с использованием 18-фтордезоксиглюкозы — является чрезвычайно актуальной. Учитывая высокую частоту местнораспространенных форм рака желудка и сложность их дооперационной оценки, представленная работа вносит значительный вклад в диагностику и предоперационное планирование.
Новизна исследования заключается в акценте на локальной оценке опухолевой инвазии мезогастрального слоя, что до сих пор недостаточно представлено в литературе. Впервые установлена корреляция между денситометрической плотностью периопухолевой клетчатки на КТ и накоплением 18-ФДГ при ПЭТ/КТ, что может существенно улучшить диагностику истинной опухолевой инвазии.
Предложенная методика 3D-визуализации мезогастрия с использованием ПЭТ/КТ обладает высоким потенциалом для применения в клинической практике. Она может быть использована для точного планирования хирургических вмешательств, что соответствует современным требованиям онкологической хирургии.
Авторы соблюдали все нормы этики. Исследование было одобрено Локальным этическим комитетом, а все участники дали письменное информированное согласие на участие.
Методы исследования логично связаны с заявленной целью и включают использование современных подходов (ПЭТ/КТ, 3D-моделирование). Описание протоколов проведения обследований и обработки данных представлено подробно и четко. Выводы статьи основаны на результатах визуального анализа, морфологических данных и 3D-реконструкции. Несмотря на ограниченную выборку пациентов, авторы обоснованно подчеркивают необходимость дальнейших исследований для подтверждения эффективности методики.
Научная терминология использована корректно, с соответствием стандартам области. В тексте отсутствуют двусмысленные или некорректные формулировки. Использованные литературные источники включают современные международные исследования и отечественные работы, что подтверждает валидность анализа. Однако дополнительное включение недавних публикаций могло бы расширить контекст. Текст работы структурирован логично, ключевые тезисы изложены последовательно. Описание методов, результатов и обсуждения выполнено на высоком уровне. Язык статьи грамотный, научный стиль выдержан. Для статьи на русском языке уровень изложения соответствует стандартам научных публикаций.
Учитывая высокую научную ценность статьи, у рецензента есть небольшое замечание:
- ограниченность выборки и отсутствие статистического анализа.
РЕКОМЕНДАЦИИ НАУЧНЫХ РЕДАКТОРОВ ЖУРНАЛА / RECOMMENDATIONS OF THE SCIENTIFIC EDITORS OF THE JOURNAL
Цель исследования в абстракте и в последнем абзаце введения должна совпадать.
После цели исследования следует раздел Материалы и методы. Какой опыт Вами получен – это текст для обсуждения.
6. Результаты.
7. Обсуждение.
Должно начинаться с Ваших собственных данных. Необходимо их сравнить с уже опубликованными. В конце заключения необходимо уточнить ограничения проведенного исследования и обозначить направления для дальнейших исследований.
8. Заключение.
9. Список литературы.
10. Необходимо выполнить все технические требования журнала к оригинальным исследованиями в части аббревиатур, последовательной нумерации источников литературы, предоставить рисунки в отдельных файлах в требуемом качестве (ссылка на требования к изображениям на сайте https://www.sechenovmedj.com/jour/manager/files/1/Подготовка_иллюстраций_S MJ.pdf.
8-2 Trubetskaya st., Moscow, 119048
Federal State Autonomous Educational Institution of Нigher Education I.M.Sechenov First Moscow State Medical University of the Ministry of Health of the Russian Federation (Sechenovskiy University)
E-mail: sechenovmedj@staff.sechenov.ru
Processing of personal data


